BedGraph and Wiggle Files
The BedGraph format is a simple four-column, tab-delimited format and the Wiggle format is a simple two-column, tab-delimited format, both of which are popular on the University of California Santa Cruz (UCSC) browser for displaying numerical data. If a bedGraph or wiggle file is dropped on the Maps tab stage, the Open File window will appear and the data will be loaded. If the file is loaded through the File menu, then you must ensure that the file type is set to "All files (*.*)" or "BedGraph/Wiggle Files" in order for the file to be recognized. A notification of successful file loading will appear in the lower left corner of the window. The data can be saved by itself—accessible in the External Data Map Set on the Maps tab—or it can be linked with an existing Map Set by selecting a Map Set in the window. The data will be displayed as a track in the associated Map Set.
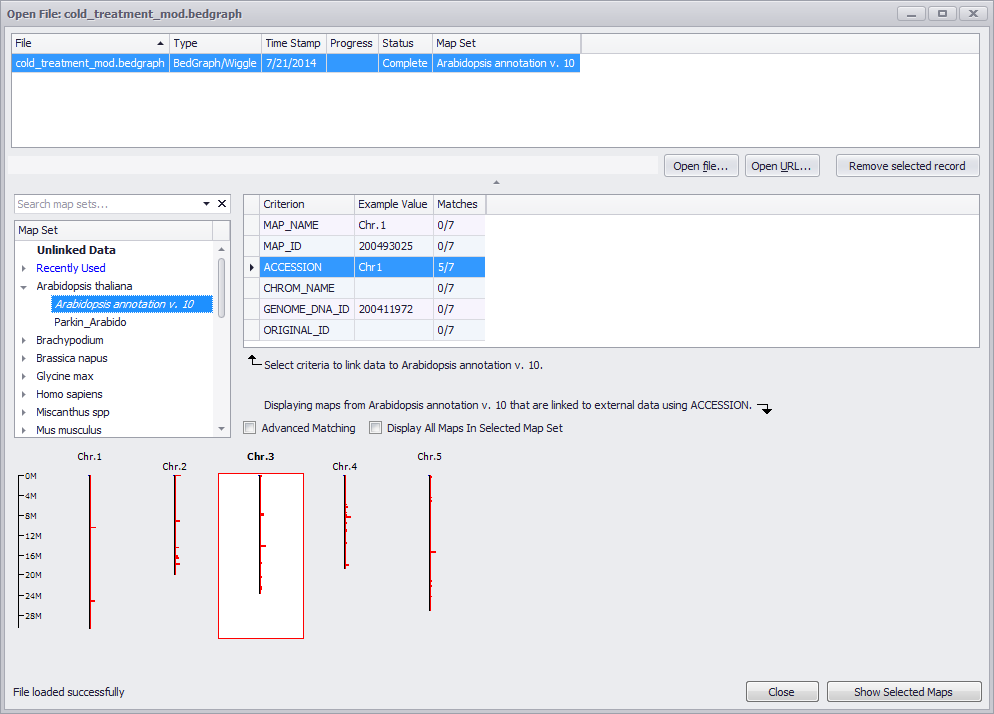
The data will appear in the External Data selection of the Map Set list. It can be removed from the list by clicking on the data entry and right clicking to get the right-click menu. The data file can also be removed by selecting file in the uppermost panel and clicking the Remove selected record button. If a map set is selected in the Map Sets window, the data will be added as a track in the appropriate annotation map. You can then display the new data track by selecting one or more of the chromosomes in the graphic and clicking the Show Selected Maps button.
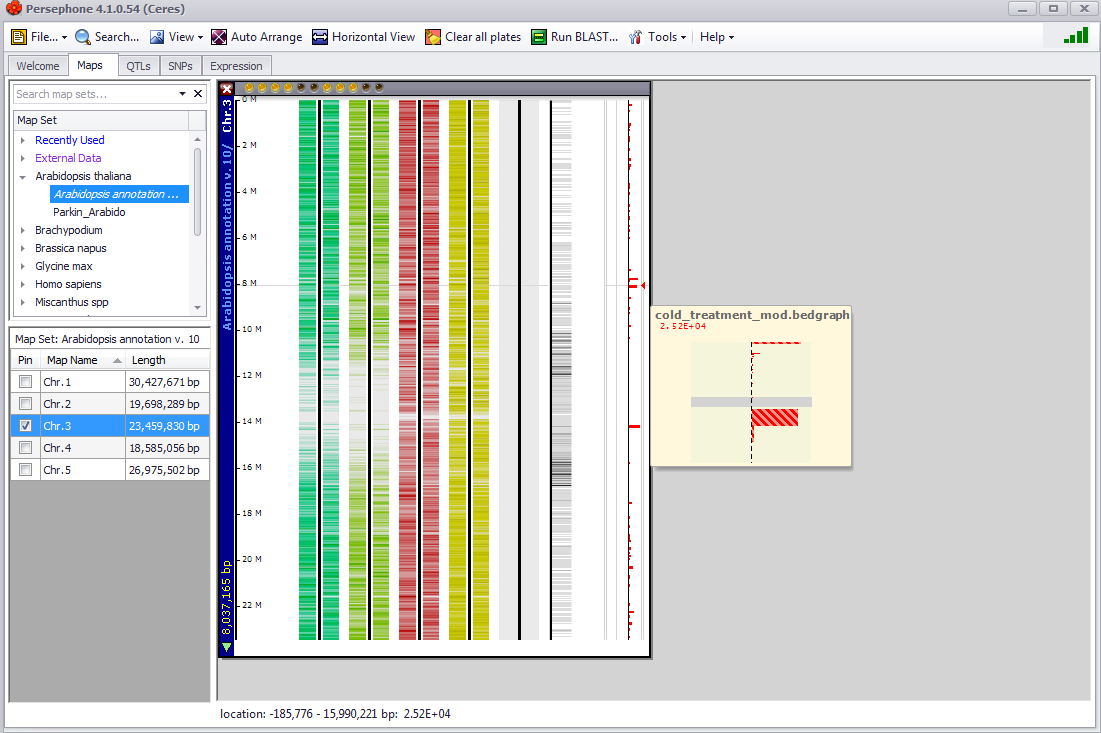
The vertical bar with red horizontal tick marks (data track) displays the data from the bedGraph file. Holding the mouse pointer over one of those tick marks - note the horizontal hairline and the small red arrowhead in the rightmost lane - produces the small graphic to the right of the plate, and displays the source of the data and the data value. The location of the data is also listed below the main graph along with the data value.
 Copyright © 2009-2021 by Persephone Software. All Rights Reserved.