Data Tabs
Each tab in the application is a source of novel information and provides different features associated with the type of data. Available data include genomes, traits, variants, expression, and many other genomic and genetic information sets. Each tab and the type of information contained are described below.
Welcome Tab
The Welcome tab contains general information about the Persephone application, announcements, contact information, quick start and reference documents, and a variety of training materials, including video tutorials.
You can customize the Welcome tab to the needs of your organization and users. For example, you could add a link to your intranet, include FAQs, list Persephone updates, list genome database updates, or anything you find useful.
Tip
Refer to Optional Welcome Page in the Setting up the Persephone System guide for steps to customize the content of the Welcome tab.
Maps Tab
The Maps tab views available physical (DNA based), genetic (linkage groups), and scaffold maps. Available information includes all data installed with the application and any additional customer-specific imported data. A map set (genome) contains a set of maps (for example, chromosomes) from an experiment or publication. Map sets typically contain a group of chromosomes or linkage groups. You can open multiple maps simultaneously as long as each map contains at least one vertical track of data (for example, gene models).
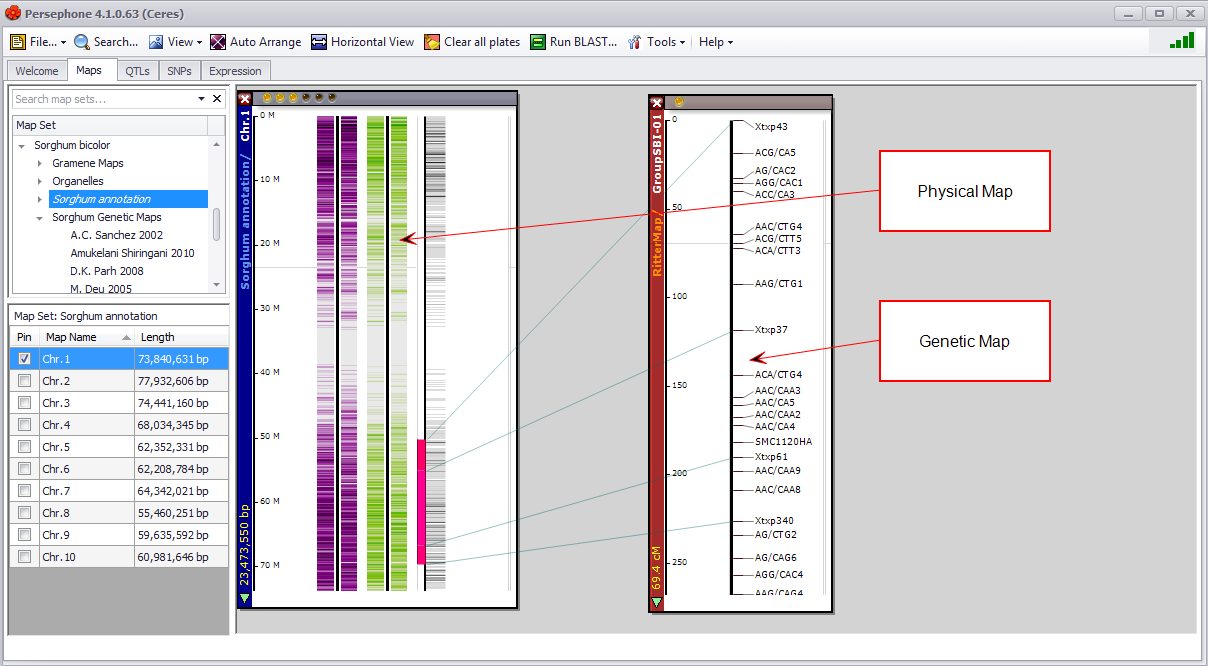
Maps can be freely dragged around the screen to produce the desired visualization. They can also be zoomed in and out, closed, and auto-arranged as a group or individually. Each map can have many vertical "data tracks", which display the data.
See Maps Tab for more information.
QTLs Tab
The QTLs (Quantitative Trait Loci) tab opens the QTL Browser (a search and filtering window). Use this window to specify search parameters such as Organism, Source, Trait, and Study to filter down information to a targeted set of studies or one study.

See QTLs Tab for more information.
Note
You can only display studies with the same map set type (genome) simultaneously (for example, two studies with the same genetic map or multiple studies with the same physical map).
SNPs Tab
SNPs (Single Nucleotide Polymorphisms), a simple form of sequence variants, refer to the position of a single nucleotide that differs when compared between samples or to a reference genome. To explore SNPs, click the SNPs tab and select the species and genome you would like to find individual samples and variants for. A new sample selection screen appears. All samples and variants associated with the selected species and genome will be displayed and you can filter and sort the samples to identify and select the targeted set of samples to continue to work on.
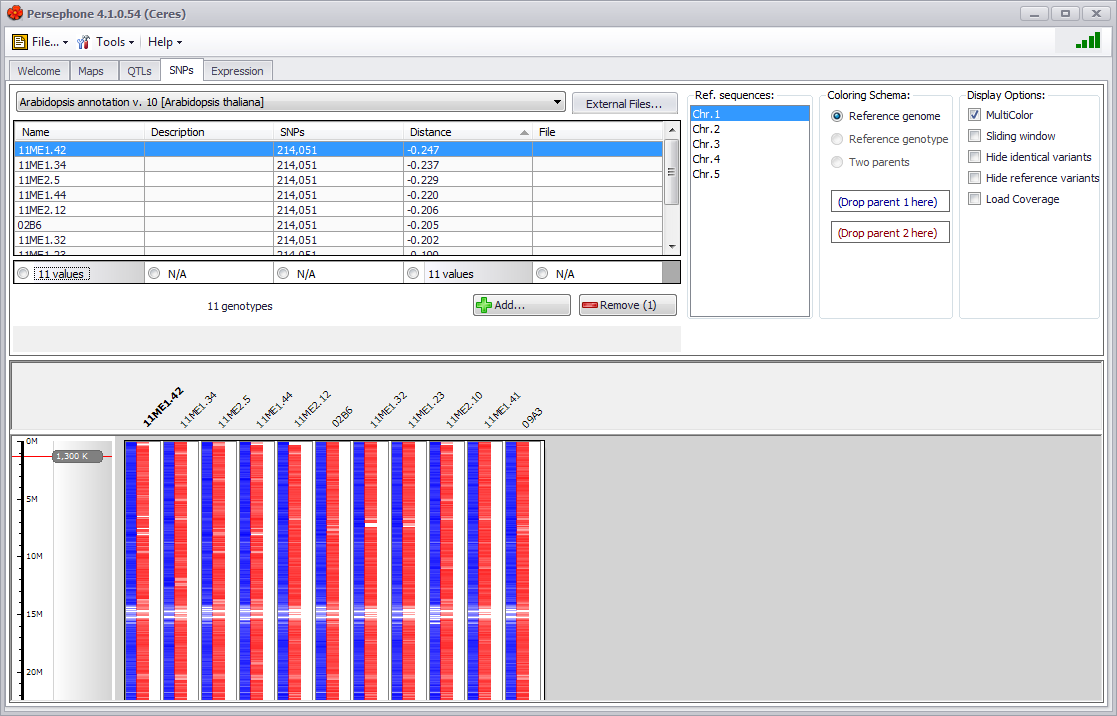
See SNPs Tab for more information.
Expression Tab
To explore Expression data associated with individual samples, click the Expression tab and select the species and genome you would like to find individual samples and expression data for. A new sample selection screen appears. All samples containing expression data associated with the selected species and genome will be displayed and you can filter and sort the samples to identify and select the targeted set of samples to continue to work on.
Tip
Expression data is routinely normalized per experiment (which can be one of the filter criteria in the sample selection screen) so visualizing information across multiple experiments could lead to false conclusions.
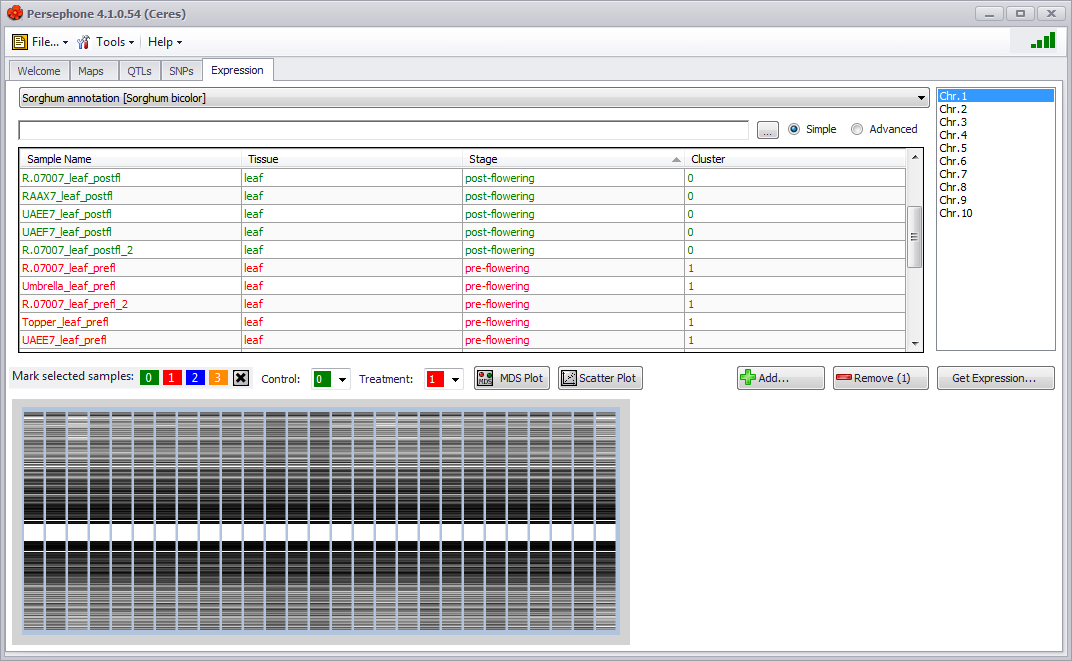
See Expression Tab for more information.
 Copyright © 2009-2024 by Persephone Software. All Rights Reserved.