Expression Analysis
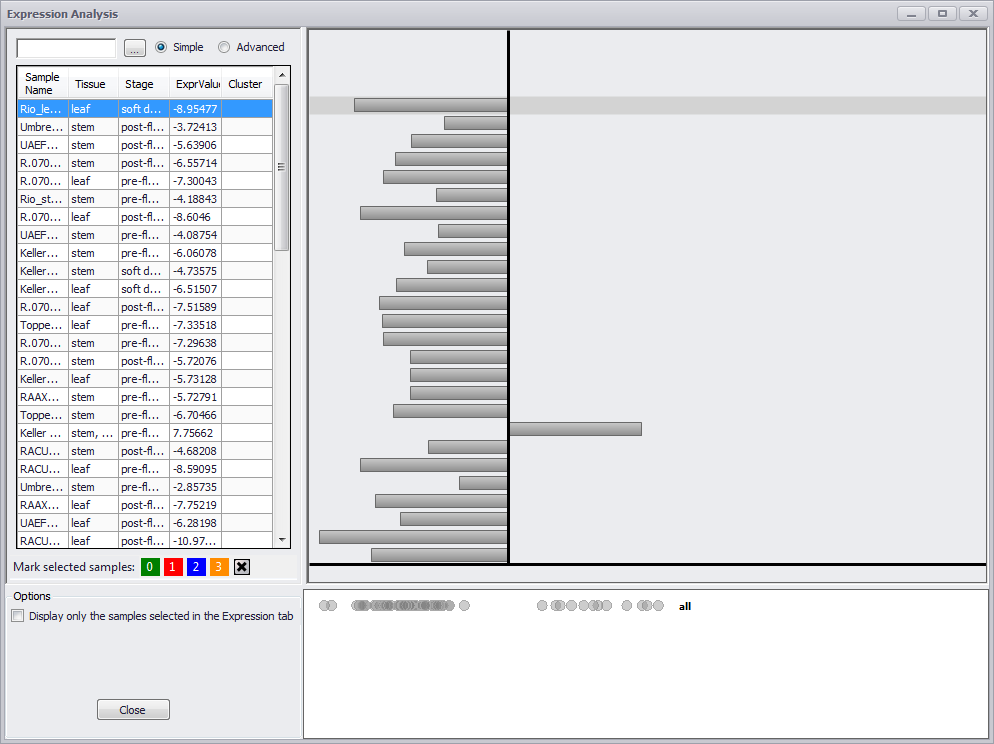
Click the Expression Analysis button to open the Expression Analysis window with the RNA-seq values and metadata in a table on the left and a grayed out bar graphic on the right as shown below. To limit the values to just those in the original group you are analyzing, click the Display only the samples selected in the Expression tab checkbox in the Options panel. This option will not be present if you have navigated here from the Annotation Details window from a gene in a data track from a plate in the Maps tab.
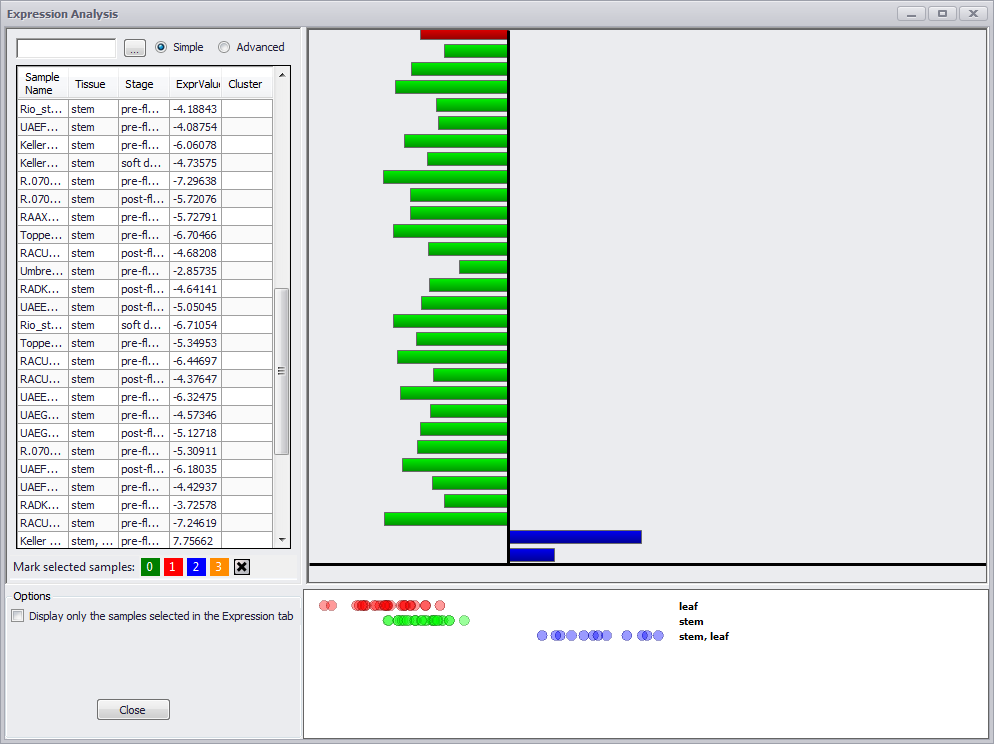
If you make an entry in the search field at the top left of the window, only those rows with a match in one or more columns will be displayed. If you click in the column header for Stage, the values are sorted by stage and the graphic on the right is colored. It is critical to note that the graphic will remain gray until one of the columns in the table is sorted. This applies whether you are coming to the Annotation Details window from the Expression tab or from the Maps tab (or anywhere else).
The text boxes on the left, above the data grid are used for a quick search. Once you have started typing, the data grid below will become filtered by the word being entered. In the Simple mode the table will display a row if at least one of the columns for the row contains the search word.
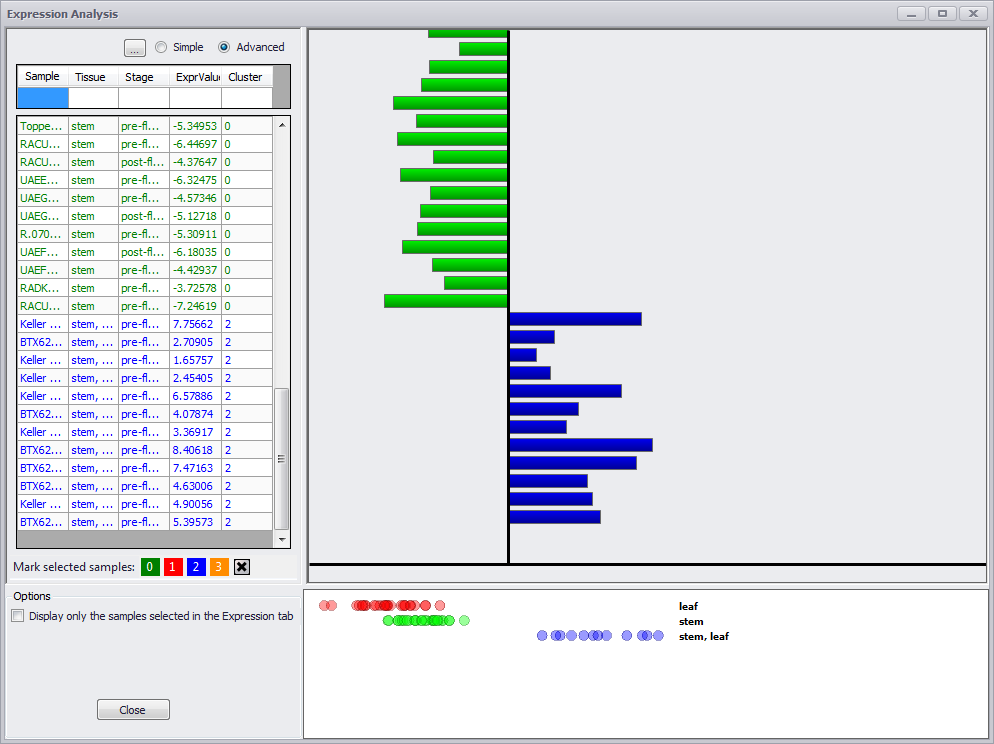
The ellipsis button (…) provides a drop-down checkbox list of column names to determine which column names will be displayed. If the Advanced radio button is clicked, the search field is eliminated but the ellipsis button is displayed. A search field appears under each column name and if an entry is made in a field only those rows with a match to the entry in that column will be displayed
The Advanced mode filters the grid based on the search criteria for each column (image below).
Sorting any of the columns will trigger coloring of the values in the chart. The expression values will be categorized based on the value in the sorted column. This means that there will be as many clusters (or categories) as there are distinct values in the column. For each category a "blot" plot will be produced on the bottom right. Each "blot" corresponds to the expression of the gene in a sample with specified category.
The clusters can be assigned manually. To do this, first select rows for a cluster and click one of the colored buttons (from 0 to 3). To display expression for separate clusters, just sort the Cluster column.
 Copyright © 2009-2024 by Persephone Software. All Rights Reserved.