Horizontal View
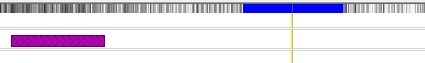
Data tracks in Persephone maps are normally displayed in vertical tracks. However, a subset of data can be viewed horizontally. If you click on the Horizontal View tool, a sliding selection of 1 Mbp is created to the left of the leftmost data track (see the figure below). A fine horizontal line indicates the middle of the selected region. If you position the selection region in the area of interest and click on it, the data will be displayed in a horizontal orientation.

Alternatively, you can Ctrl-click anywhere on the plate and then drag up or drag down with the mouse to select a region (see the figure below). If you want to clear the selection, you can right-click on the selection region and select Clear Region Selection from the right-click menu.

If you click anywhere in the colored selection box to the left of the data tracks — the vertical arrow is a good target — the horizontal view of the selected region will be displayed as shown below.
The zoom function also works in this view in a similar way. Move the mouse wheel to zoom in or out around the position of the mouse. Next, shift-mouse drag will define the region to zoom into. Shift-Ctrl-click will zoom completely out to the full view of the selected fragment.
Depending on the zoom level, the sequence track at the top of the screen will show different levels of details from individual nucleotides to GC-content of the sequence. GC-rich regions will be shown in a darker color. Stretches of PolyN will be painted blue:
At higher zoom, the sequence track (GC-content) will display the reverse-complement of the sequence if the track is uncollapsed.
Data Tracks
Data tracks in the vertical and horizontal displays share many similarities. Similar to the vertical data track view, the data type is displayed in a tool tip when the mouse moves over a horizontal data track. You can select or deselect panels with the small yellow radio buttons in the track panels or place the mouse pointer over a data track and right click on the mouse to hide individual panels (select Hide this Track from the right-click menu).
You can also select/deselect across all tracks available using the Show/Hide Tracks in the right-click menu, which provides a tabular listing of all tracks available with check-boxes for each track. A variety of additional options can be accessed in the right-click menu, which was discussed previously in detail under the right-click menu for vertical data tracks.
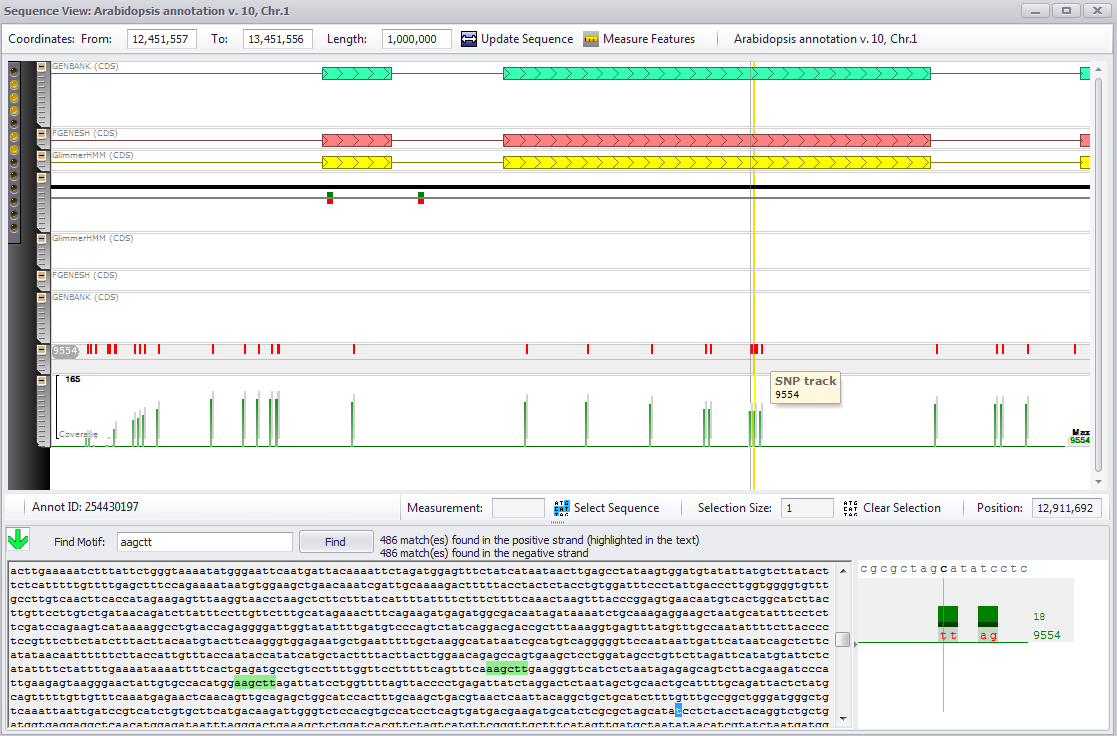
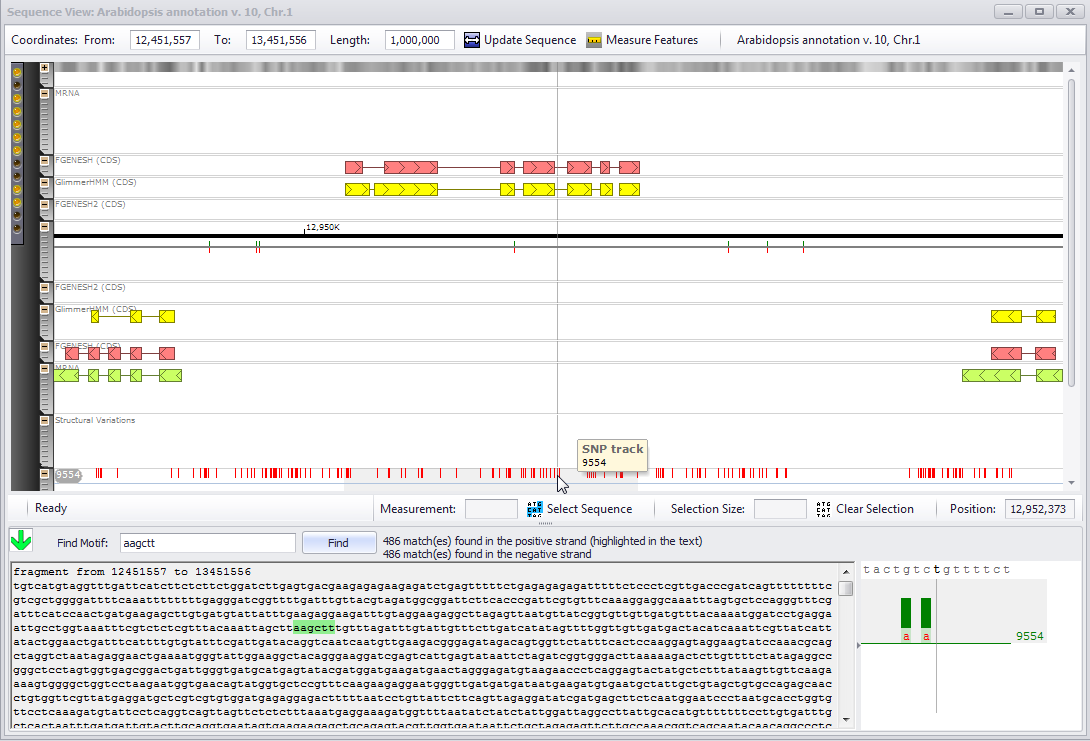
If the original sequence selection in the vertical view was on the + strand, a green downward pointing arrow will be found in the left center of the window to the left of the Find Motif field. If the selection was made on the – strand, an upward pointing red arrow will appear in that location. This corresponds to the color of the arrows in the original selections in the vertical view. Regardless of the direction of selection (i.e., strand selected), the features of the horizontal view display will be presented identically with the display going from the smallest nucleotide coordinate on the left to the largest nucleotide coordinate on the right side of the coordinate, i.e. the + strand. The sequence orientation in the lower panel is oriented consistently with the selection indicated in the From and To fields at the top of the view window, which will correspond to the appropriate strand of the original selection in the vertical view.
In the vertical view, the genes transcribed from the + and – strands are found on the opposite sides of the central black line of a data track. In the horizontal view, features on the + strand are displayed on the half of the screen above the ruler and features on the – strand are displayed on the lower half of the screen below the ruler with the exception of motif tracks which are on the same panel as the ruler. Therefore, GenBank models will have one track above the central ruler and another below the ruler.
In the case where only a single track is displayed but several different prediction models exist for the prediction method, a gray block or line will be displayed below the gene in the data track, similar to the gray line in the vertical tracks. An additional important feature of the horizontal view is that you zoom into selected data tracks to the individual nucleotide level, which is important for visualizing individual SNPs, for example.
The horizontal view window displays the parent DNA coordinates of the selection (in the From and To fields) as well as the length of the fragment (Length). You can select a new region to view by entering the new coordinates of the DNA in the From and To fields. The Position field at the bottom of the upper panel shows the location of the vertical black hairline. The Measure Features button will enable you to drop two guides to measure the length between two points. A tool tip with the current position will pop up when you select the button. You can then click the mouse to drop the initial guide on the view, move the mouse pointer to a second location — the distance will now be displayed in the tool tip — and click to drop a second guide on the view.
The Measurement field in the toolbar will display the measurement distance as well. If you click the Measure Features button a second time, it will remove both guides. In the case in which the original sequence selection on the vertical map exceeded 1 Mbp, the DNA sequence may not be displayed in the lower panel. Clicking the Update Sequence button will load and display a sequence greater than 1 Mbp in length, but this may result in a slowdown of the display.
The mouse wheel can be used to zoom in or out as with vertical data tracks. You can also press the Shift key and drag across a region to specifically zoom in on just that selection. If you hover the mouse over a feature, for example, an mRNA, a tool tip with the data track type, the Annotation ID and the gene prediction model(s) will appear. A click on a feature in the data track will bring up an Annotation Details window.
Moving the vertical thin yellow line will change the sequence displayed in the lower half of the window to include the location of the yellow line. If you click on the mouse and drag to the right or left in the sequence panel, the selected sequence will be displayed in blue. In the upper map panel, the selection will be displayed in yellow. Note that this feature is only available when the sequence has been selected from the + strand. Similarly, if you right-click and drag to the left or right on the upper panel, the corresponding sequence will be displayed in blue in the sequence panel below. You may need to scroll up or down the sequence to find the selected region in the sequence panel.
The Selection Size field displays the size of the selection. If you press Clear Selection, the selection highlight is no longer displayed and the Selection Size field is blank. The Arrow at the far left of the sequence panel indicates which sequence strand is selected and displayed in the top half of the upper map panel (green for the + strand and red for the – strand).
A right-click menu is available in the horizontal view if you right-click on a data track. However, the right-click menu is limited to Link Tracks, Show/Hide Tracks, Hide this Track, Export track, Map Properties, and Track Properties. All of these have been described in detail in the section on right-click menus for the vertical view. Relative to a vertical data track, the following five menu selections are missing from the horizontal view right-click menu: Find Synteny, Clear Region Selection (this command is already displayed as the Clear Selection button on the horizontal view window), Invert Plate, Close Plate, and Pin Plate Down.
Tip
See Gene and Gene Data Track Information for more information about the right click menu.
Motif Search
See Motif Search for more information.
Operations with Tracks: Collapsing, Hiding, Resizing, and Reordering
Data panels can be moved up or down by clicking and dragging on the gray handle (a vertical bidirectional arrow should appear when selected) to a new location. If you move the mouse to a location on the gray handle or to the left of the gray handle, the gray pop-up with buttons shown below will be displayed for each data track. The gray pop-up also displays the data type in the track, for example mRNA and GenBank CDS in the figure below.
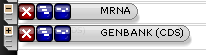
The gray pop-up at the left end of each displayed panel (shown above) also has an X button ( ), which will enable the panel to be hidden. Clicking on this button will hide the data track. Clicking on an amber button in the track panel will also hide the data. The data track can be displayed again by clicking on the appropriate radio button in the track panel. If multiple gene prediction models are present in a single panel, you can toggle between seeing one or all models using the minus sign (
 ) and plus sign (
 ) buttons to the far left of the gray panel control.
If multiple gene models are present, clicking on the plus sign ( ) button in the data panel handle will result in multiple tracks of data tracks being displayed. Clicking on the minus sign (
 ) button will result in only a single gene model being displayed Genes with multiple models (for example, due to alternate RNA transcript splicing) will have a wide gray line under the gene when the minus sign (
 ) button is pressed.
There are two additional display modes, stacked and staggered, which can be selected by clicking on the blue stacked button ( ) for a stacked display or clicking on the blue staggered button (
 ) for a staggered display.
You can return to the vertical display by closing the horizontal view display using the Close window button in the upper right corner.
SNP and Coverage Tracks
If a plate has the SNP track, all genotypes will be displayed on a separate horizontal level. At a higher zoom the NGS coverage information will be shown in a separate detailed view. Moving the mouse cursor to a genotype sub-track will fade out the coverage for all the neighboring tracks and leave only the coverage graph for the selected genotype.
A detailed view at the bottom right corner of the window will be activated when the zoom level is large enough to show individual nucleotide positions. The two colors in the bar graph correspond to a coverage value shown with different scaling methods: lighter shade bars are normalized for the region selected for the horizontal view. At the same time darker color will show the coverage compared to a maximum coverage on the whole chromosome. The exact number of reads is displayed above the name of genotype.
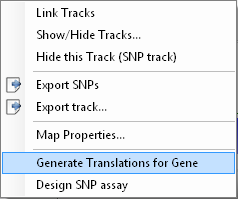
A right click on the SNP track will produce a right-click menu. The user can export all SNPs for the selected combination of genotypes and position in the sequence region.
Click the Links below for more information.
- Gene and Gene Data Track Information (for linking, showing, and hiding tracks)
- Export SNPs
- Exporting Tracks
- Map Details (for Map Properties)
- Generate Translation for Gene
- Exporting SNP Assays (Design SNP Assay)
If the mouse is positioned over a gene region, the Generate Translations for Gene menu selection on the right-click menu will be available. Select it to display the following window.
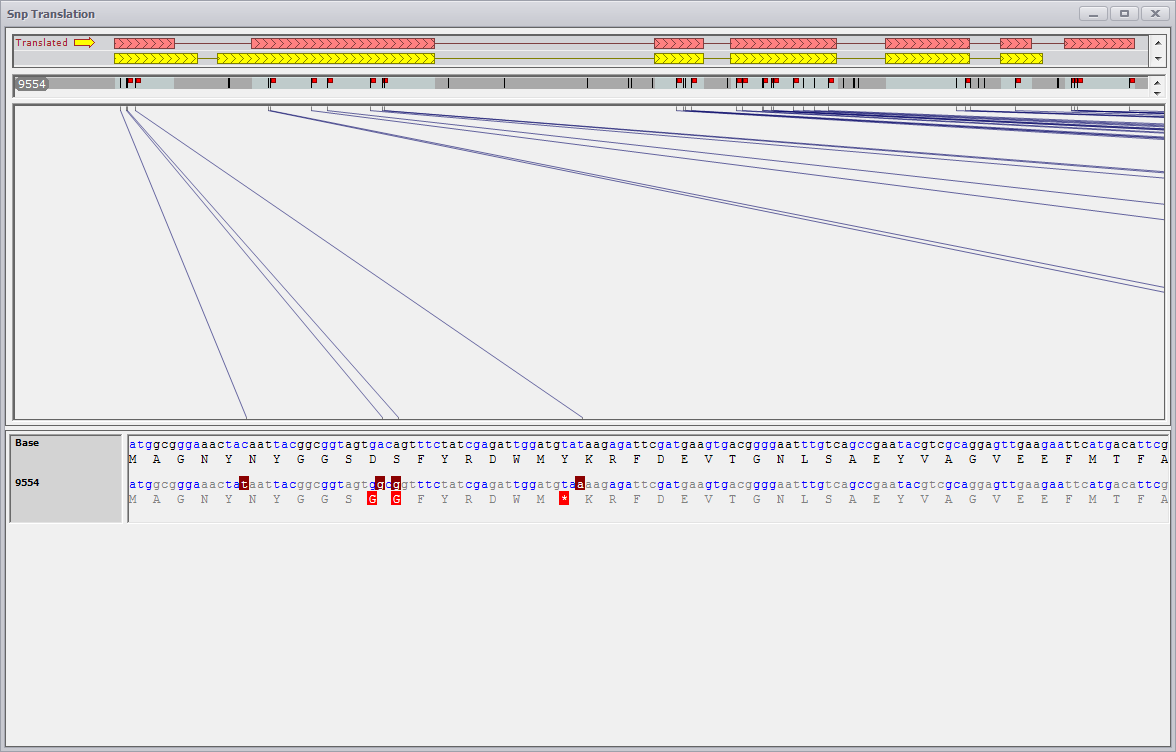
The SNP Translation view shows all SNPs that fall into the gene region and their impact on the translation. In case of multiple gene models for a locus it is possible to specify which of them should be used as a basis for translation. SNPs within exons are interactive. A click on a SNP symbol will bring the corresponding position of the gene sequence and the corresponding translation into view. The SNPs that change translation are marked as little red flags. Please note the SNPs that fall into introns are not clickable as they are not supposed to change any translation.
 Copyright © 2009-2024 by Persephone Software. All Rights Reserved.