Persephone User Guide
The Purpose
Persephone is a genomic information storage and visualization system. The technology enables researchers to store, access, and explore DNA databases in much the same way online mapping programs enable users to explore geographic regions and places. Driven by dramatically lower costs, DNA sequencing is one of the most commonly used technologies in biological and medical research laboratories. Persephone has been designed to more fully utilize what has become an overload of data by enabling the rapid and easy visualization of large amounts of genomic data by experts and non-experts alike. The software features a number of optimizations to quickly fetch and render very large data sets. Persephone can display diverse data sets such as genetic maps, genomic sequences, gene models, synteny, QTLs, sequence variants (SNPs and indels), RNA-seq coverage values, and gene expression, among others.
Introduction
The Persephone User Guide describes how to use the Persephone desktop/laptop application. Click the following links below for more information.
- Navigating Persephone
- Search
- Run BLAST
- Export
- Maps Tab
- QTLs Tab
- Trait Ontology Browser
- SNPs Tab
- Expression Tab
- Loading External Files
- Tools and Settings
- Using Advanced Filters
- For Administrators
Persephone Terminology
The figure below shows the terminology used in Persephone and how these terms relate to each other in a hierarchical form.
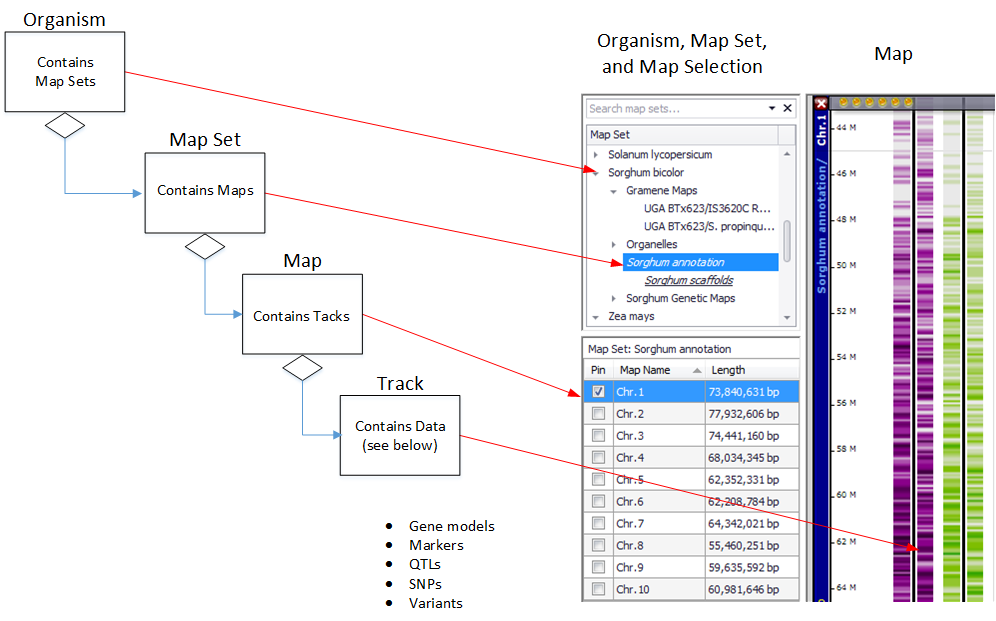
These terms are defined in the sections below.
Map Set
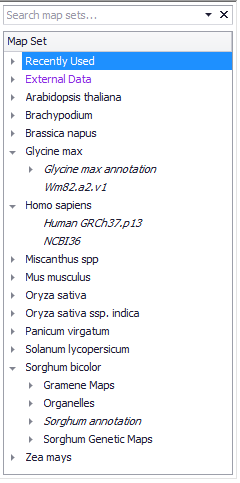
Each Major node is an organism (or species). Each species Node can have multiple sub-nodes (Map Sets) consisting of physical (DNA-sequence based) maps, and/or genetic maps (centiMorgan based), and/or scaffold maps (DNA sequences not fully assembled into chromosomes). A species tree node can contain multiple versions of a genome assembly. Map sets are shown in a tree and are grouped by their source organism as shown below.
Map Types: Genetic, Physical, and Scaffolds
Maps are categorized into the following types.
- Genetic (Linkage) Maps. A genetic map is a map that lists genetic markers and their linear positioning in centiMorgan distance.
- Physical Maps. A physical map is a map that has been assembled using DNA sequence.
- Scaffolds. Scaffold maps show an ordered and oriented set of contigs.
The figure below shows physical, genetic, and scaffold maps, respectively, for Zea mays (corn), and foxtail.
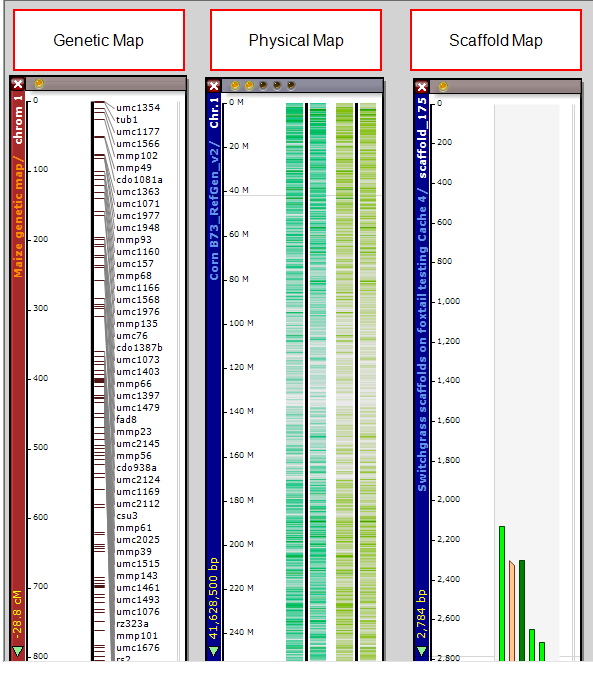
See Map Types for more information.
Stage (Persephone Term)
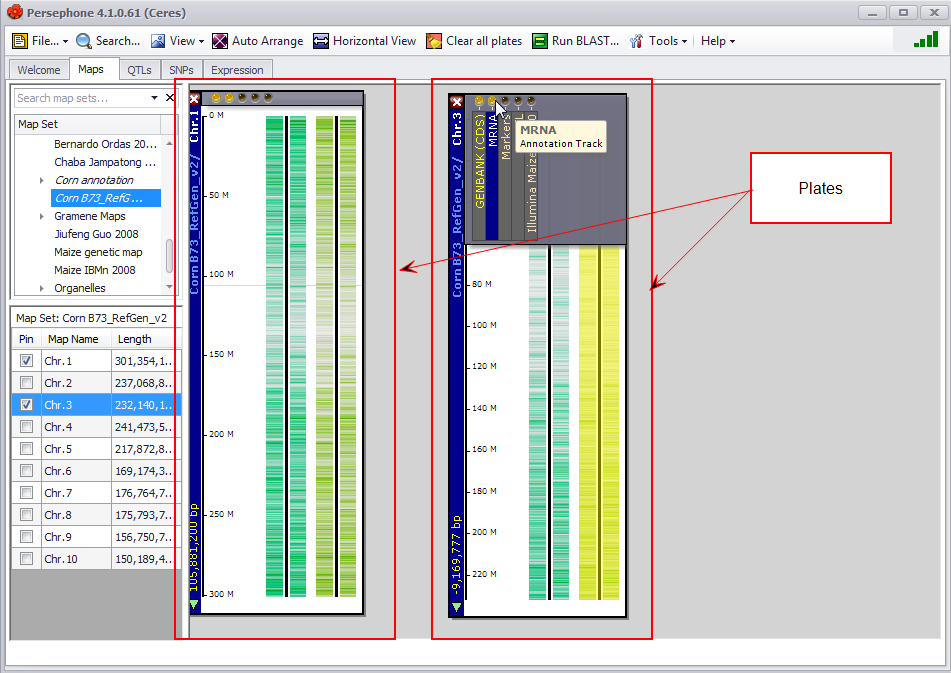
The stage refers to the space used on the Maps tab to display data and manipulate information. You select plates (described below) to view on the stage.
Plate (Persephone Term)
A plate is a graphical window on the Persephone stage that represents any type of genetic or genomic data that can be mapped or linked to a physical, genetic, or scaffold map. Each plate can have any number of tracks. The plate on the left in the figure below has two annotation tracks: (1) Coding Sequence of genes (CDS) predicted by GenBank and (2) full-length transcripts (mRNA).
Track (Persephone Term)
A track is a graphical representation of any type of genetic or genomic data that can be mapped or linked to a physical, genetic, or scaffold map. Each plate can have any number of tracks. The plate on the left in the figure below has two tracks: a protein Coding DNA Sequences (CDS) track and an mRNA annotation track.
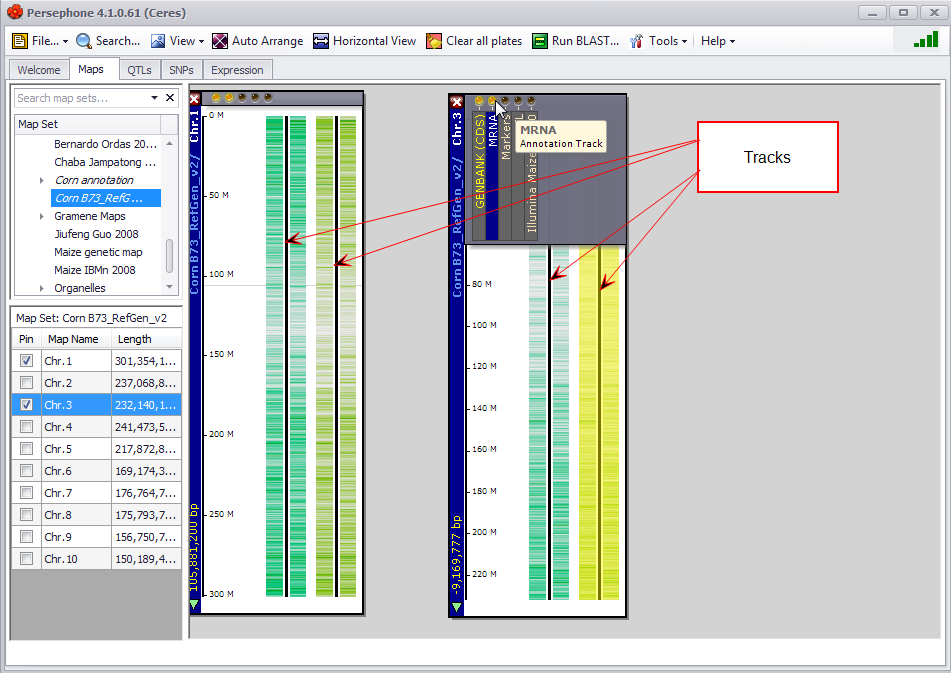
Other track examples include QTLs, variants, quantitative data, and generic tracks showing features as intervals on genome like repeat regions, etc.
Launching the Application
The default location of the Persephone start icon is on the desktop. To launch the application from the desktop, double click on the icon.
![]()
You can also launch the application from the Start menu by typing "Persephone" and pressing ENTER.
 Copyright © 2009-2024 by Persephone Software. All Rights Reserved.