QTL Browser
Click the QTLs tab to open the QTL Browser (a search window). A Browse button in the toolbar is displayed only when you are in the QTLs tab. (When the QTL tab is first selected, the QTL Browser will open automatically.) Clicking the Browse button takes you to the QTL Browser window from anywhere within the QTL tab. Use this window to specify search parameters such as organisms, sources, traits, and studies. Please note in the QTLs tab, the Search button in the toolbar is limited to searching for QTLs.
Tip
Hover your mouse pointer over the Trait Ontology Browser icon (![]() ) in the Trait column to display information about the trait. Clicking this icon will open the Trail Ontology Browser, which is described in Trait Ontology Browser.
) in the Trait column to display information about the trait. Clicking this icon will open the Trail Ontology Browser, which is described in Trait Ontology Browser.
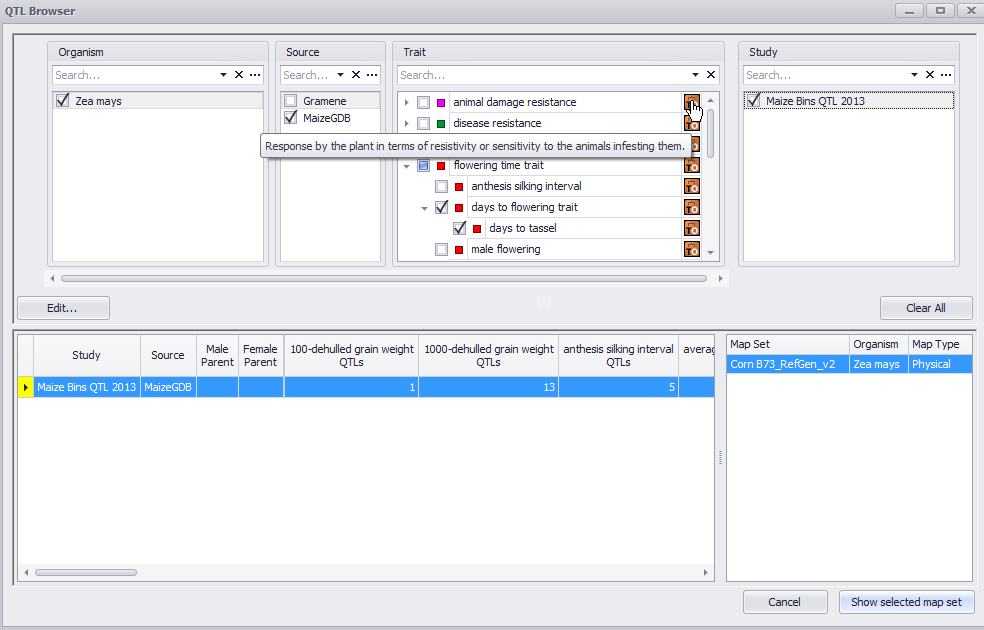
After specifying the search information, studies that meet your criteria are displayed. Select a study (or multiple studies, see the note below) to display and click the Show selected map set button to open. A window containing the chromosomes of the subject organism displays. In the map set, the locations of the associated QTLs display along the chromosome length.
Note:
You can only display studies with the same map set type together (for example, two studies with the same genetic map or multiple studies with the same physical maps). In addition, you cannot display the same trait from two different species (for example corn and rice). These limitations result from Persephone displaying the actual subject organism's chromosomes.
In the upper panel (figure below), the distribution of QTLs by trait is given in a table. The horizontal scroll bar will show any additional QTLs and information if the screen is not wide enough to display all of the data at one time. The central panel contains the color code legend for the highest (most general) level of QTL trait selected in the QTL browser. The lower panel shows the QTLs displayed by chromosome.
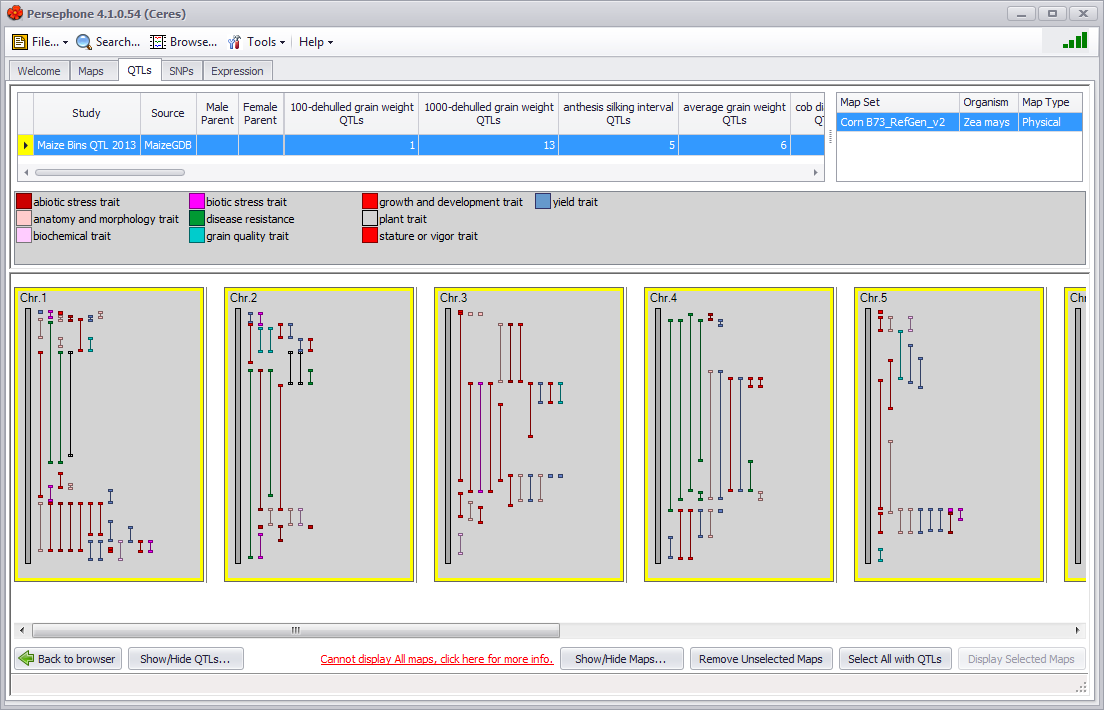
If you place the mouse arrow over a QTL in the chromosomal map, the mouse arrow will display as a small hand, the QTL will be highlighted in yellow and the QTL name and description will be displayed in the window margin at the lower left corner. The names of the left and right markers for the QTL will be displayed as well in a horizontal orientation. Markers will only be displayed as long as the QTL is highlighted.
The QTLs can be shown either with or without names. QTL names are displayed in a vertical orientation unlike marker names, which are displayed in a horizontal orientation. Right-clicking on a QTL will bring up a right-click menu with three choices: Show QTL names, Hide this QTL, or Show/Hide QTLs.
- Show QTL names. Lets you toggle between displaying or not displaying QTL names.
- Hide this QTL. Lets you hide a specific QTL.
- Show/Hide QTLs. Provides a listing of all QTLs, which you can select to display or deselect to hide.
Right-clicking anywhere else (i.e., not on a specific QTL) in a chromosome selection box will provide you only with the Show QTL names and Show/Hide QTLs choices. The QTL names can also be displayed by default by clicking the Show QTL Names checkbox (Tools>Settings>General Display). (See Settings for more information.)
 Copyright © 2009-2024 by Persephone Software. All Rights Reserved.