QTL Details
Clicking on a highlighted QTL in the Map tab window or in the QTL tab window will bring up the QTL Details window (see the figure below). The Basic Properties tab shows information about the QTL itself and the study from which it was derived. The QTL Details window is displayed when you click on a QTL in the chromosomal graphic at the bottom of the QTLs page or alternatively when you click on a QTL in a QTL marker data track in the Maps tab window.
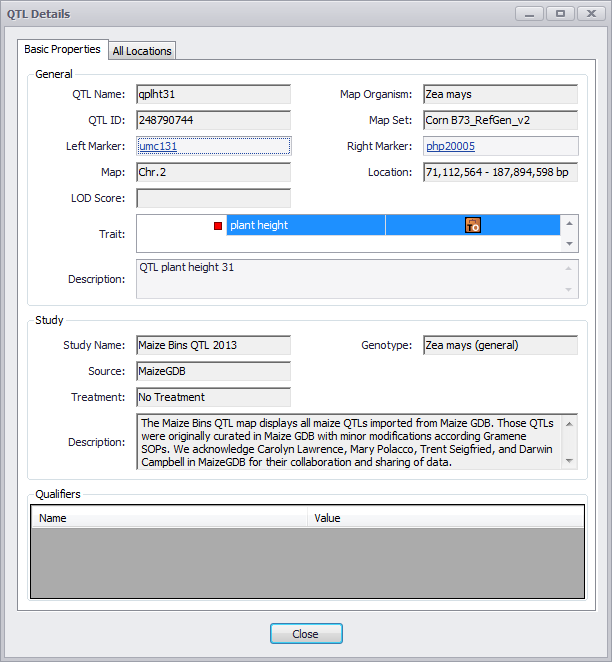
There are two tabs in the window: Basic Properties and All Locations. The Basic Properties tab shows information about the QTL itself and the study from which it was derived. Note that not all fields may have data depending on the organism and level of annotation.
Basic Properties Tab
General (Top Section)
QTL Name
The name of QTL used in Persephone.
Map Organism
The organism used to create the map.
QTL ID
The ID for the QTL internally generated in Persephone database.
Map Set
The map set for the QTL.
Left Marker
The marker for left boundary of QTL. Click the marker name to open the Marker Details window (see Marker Details).
Right Marker
The marker for right boundary of QTL. Click the marker name to open the Marker Details window (see Marker Details).
Map
The map selected, typically the chromosome.
Location
The physical (in bp) or genetic (in cM) location (a range) of the QTL.
LOD Score
A statistical score measuring the likelihood of two genes being close to one another.
Trait
Displays the trait(s) location in the trait hierarchy (in the QTL browser), which was used to filter for this QTL. If you hover your mouse pointer over the Trait Ontology Browser icon ( ) in the Trait box it will display information about the trait.
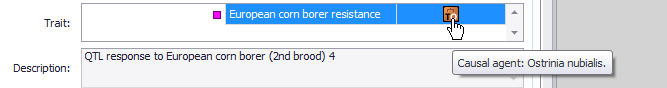
Clicking this icon will open the Trail Ontology Browser, which is described in Trait Ontology Browser.
Description
Information about the QTL.
Study (Middle Section)
The Study panel has the following fields:
Study Name
The specific study that the QTL was derived from.
Genotype
The genotype used in the study.
Source
The source of the data used for this QTL in Persephone.
Male Parent
The male parent of the cross.
Treatment
Notes any treatment used in the study.
Female Parent
The female parent of the cross.
Description
A text description of the study.
Qualifiers (Bottom Section)
The Qualifiers panel is located at the bottom of the Basic Properties tab window. It contains name-value pairs of information about the QTL and/or study.
All Locations Tab
The All locations tab (see the figure below) has information on the location of the QTL as well as the position of any other instances of the marker. The upper panel has a table with the following fields (defined previously): Organism, Map Set, Map, and Map Position (same as Location).
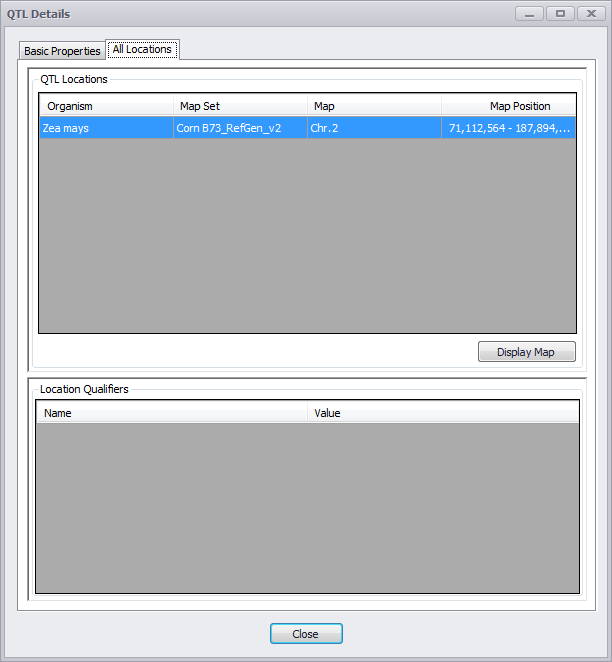
Clicking the Display Map button will display the Map for the highlighted QTL with the Map Position already selected for horizontal view. The Location Qualifiers panel has name-value pairs about the location of the QTL.
 Copyright © 2009-2024 by Persephone Software. All Rights Reserved.