Selecting Genotypes/Samples
The Select Map Set drop-down list at the top left of the window allows you to select a physical map with associated SNPs. The External Files button will enable you to import SNP data (see Loading External Files) and display it with a reference genomic sequence. If the external SNP data has already been imported, it will already be displayed as part of the physical map.
When you select a Map Set from the Select Map Set drop-down list, the Select Genotypes window will be displayed (see the figure below). The column name list on the right is primarily phenotypic traits. Note that if you have imported external data, then the map set you associated with that imported data must be selected to see the data.
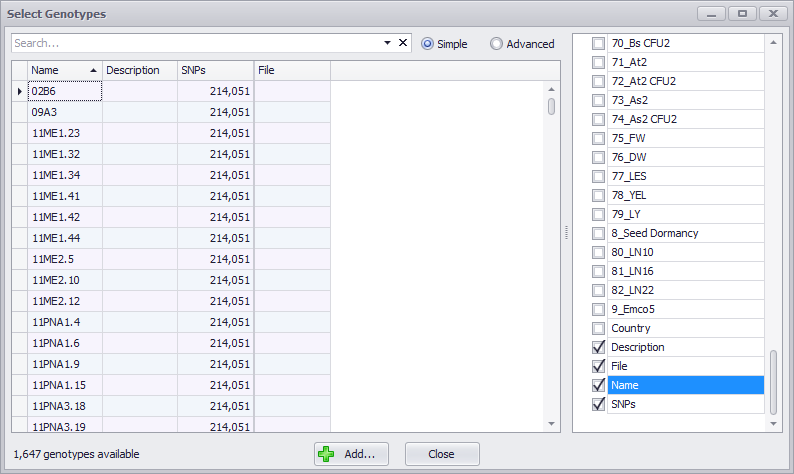
You can sort any of the columns by clicking on the name of the column. You can also add any of the column names (phenotypes) in the scrolling checkbox menu on the far right to give you additional search parameters. If you have external data you want to use, it is useful to have the File field displayed, which will give you the name of the imported file(s). You can search for specific text by typing it into the entry field at the top left of the window. Any sample row with that search entry present in any column will be displayed with the match highlighted.
Tip
If you click the Advanced button at the top of the window this will change the genome browser to advanced mode. See Display Options for more information.
Add genotypes to your workspace by clicking the Add button. The number in parentheses on the button shows how many rows are currently selected. The list of columns is presented on the right. Typically, they are associated with phenotypic measurements such as Height for each genotype. Checking the checkbox will add a column that can be used for sorting the genotypes later.

The SNPs Tab will be updated as shown in the example below.
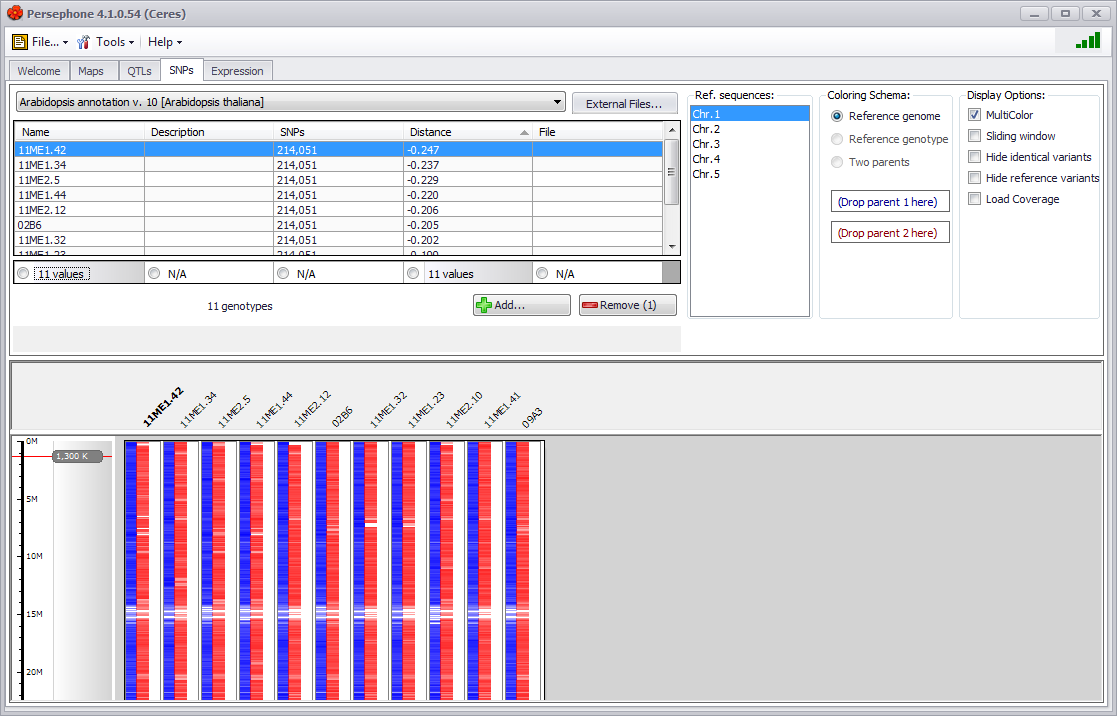
The Distance column will show genetic distance between genotypes. If the Reference genome radio button is selected in the Coloring Schema panel, the distance will be calculated between each genotype and the reference genome.
 Copyright © 2009-2024 by Persephone Software. All Rights Reserved.