Selecting Samples
When you select a Map Set on the Expression tab, the Select Samples window is displayed (see the figure below). The ellipsis button (…) displays a pop-up checkbox menu of the column names, which you can select. You can select the column names to be displayed from the checkbox menu on the right side of the Select Samples window as well.
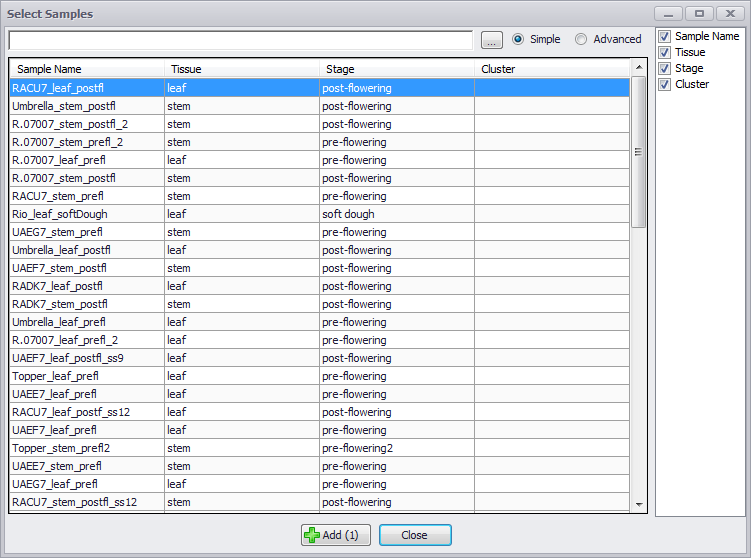
Clicking on the column names will sort the samples. The default mode for filtering samples is Simple. Text entered into the entry field to the left of the ellipsis button will filter across all columns as it is entered. Checking the Advanced radio button will produce text boxes below each column of the sample display. The general entry field for the Simple mode is hidden. Typing text into any one of these column fields will filter just the data in that column. You can select samples by row by clicking on them or using Ctrl-click or make contiguous selection using the Shift key and click. Click the Add button and the samples will appear in the Sample table in the upper panel. To return to the starting Expression tab window, click the Close button.
You can also add or remove samples using the Add button (takes you to the Select Samples window) or the Remove button in the SNPs tab window. A chromosomeselection menu is located at the upper right of the screen and will enable you to select and look at the chromosomal expression profiles for each chromosome. Click the Get Expression button and a chromosomal graphic with expression patterns will be created in the lower panel (see the figure below). Note that each time you select a new chromosome you will need to also click on the Get Expression button to retrieve the appropriate expression data set.
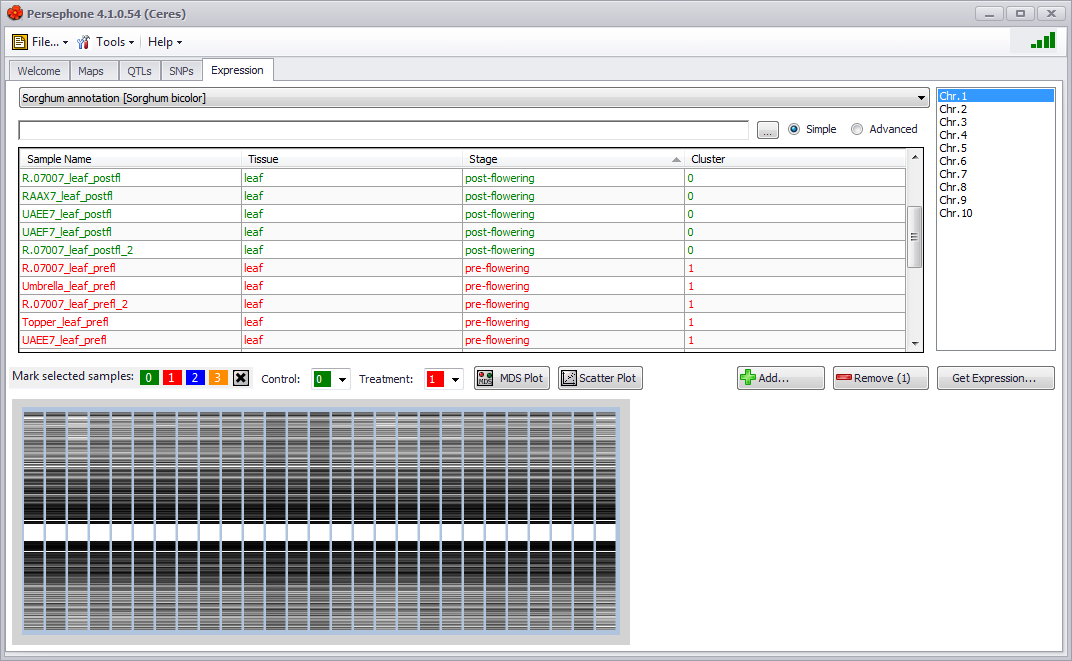
If you select one or more samples, you can assign them to a control or treatment group by assigning them a color in the Mark selected samples section. The selected samples can be assigned a color by clicking on one of the numbered color buttons. The color can then be assigned as a control or treatment by assigning the color in the Control or Treatment drop-down list. The Control or Treatment sample groups can be changed by changing the color assigned to the group in the Control or Treatment drop-down lists. Samples can be deselected from a group by clicking on the X button. If no control or treatment samples are assigned, only the MDS Plot button will be active for differential expression analysis.
If you click anywhere on the chromosomal graphic a new physical chromosomal map will open up in the Maps tab with expression data tracks (see the figure below). The expression data tracks will not have the standard screen tip identifier when the mouse arrow is held over the track; however, individual expression data track identifiers will be shown in the lower window margin beginning at the left side of the stage.
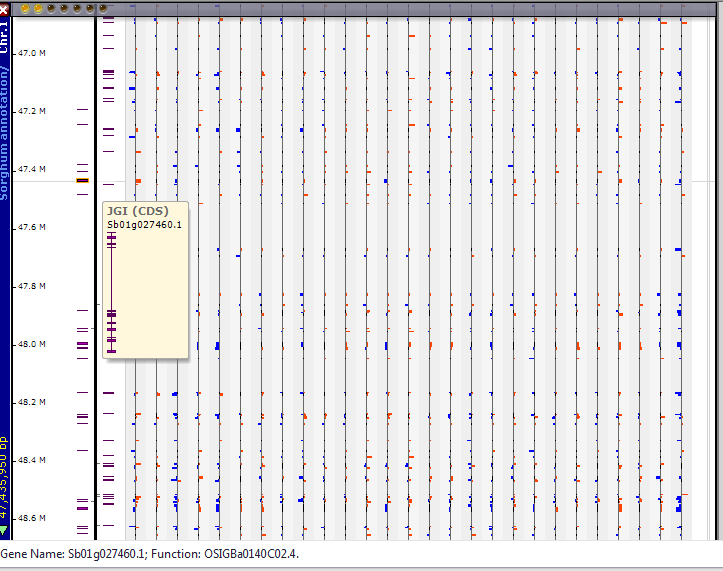
The graphic with the zoomed in section (shown above) shows expression values for over-expressed (red) and under expressed (blue) genes. Note the screen tip for the gene in the leftmost data track, which allows you to identify a specific gene to associate with an expression pattern. Additional annotation for the gene is given in the lower window margin at the left side of the stage.
If you click on the MDS Plot (MultiDimensional Scaling) button or the Scatter Plot button in the Expression tab window, a Differential Expression window is displayed (see the figure below). Only a scatter plot will be generated if the Scatter Plot button was clicked. An MDS and Scatter Plot will be displayed if the MDS Plot button was clicked.
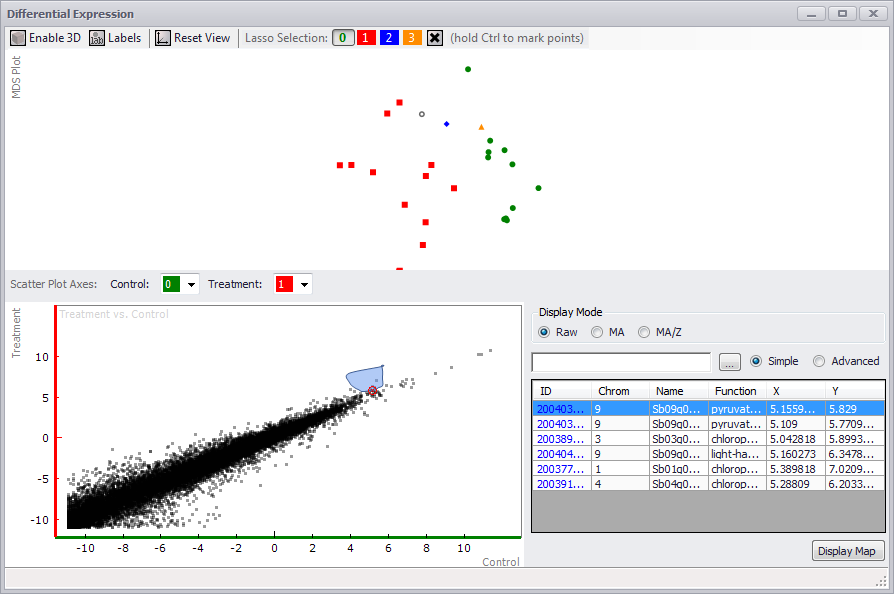
In the MDS Plot panel at the top, if you click on the Enable 3D button, the points are displayed on an x-y-z axis and can be rotated to view the relationships between the data (see the figure below). You can toggle labels for each point on or off with the Labels button. If you click Reset View, the original distribution of data will be restored.
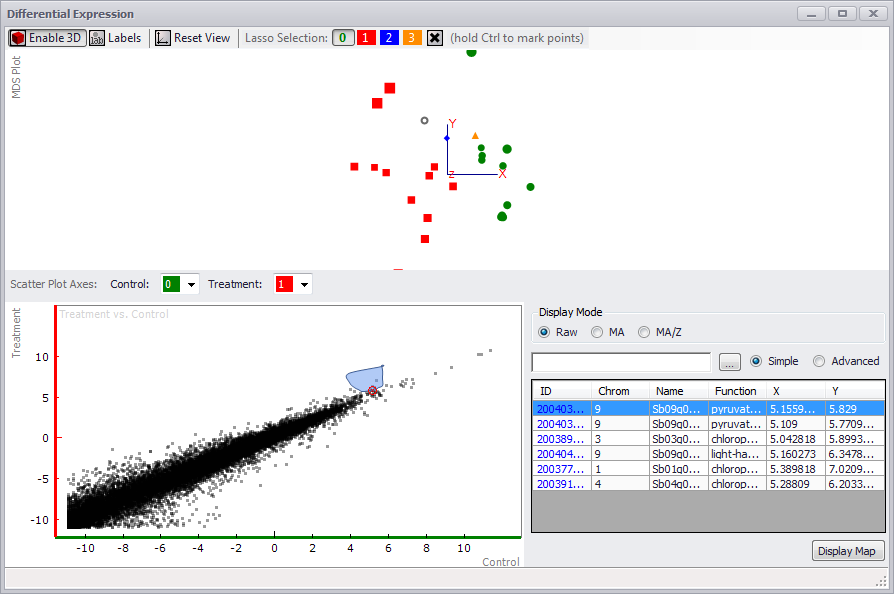
If you did not assign controls and treatments to samples in the original Expression tab window, you can do so in the Differential Expression window MDS Plot panel. Hold down the Ctrl key and lasso a point or points. Assign a color for the selected point(s), by clicking on a numbered color button at the top of the screen. Click anywhere in the MDS Plot screen to clear the lasso. You can assign controls and treatments by assigning a specific color in the Control and Treatment fields for the Scatter Plot Axes at the top of the Scatter Plot panel. However, if you assigned controls and treatments prior to opening the Differential Expression window, the Scatter Plot will be displayed automatically.
The scatter plot can be displayed in three forms by clicking the RAW, MA, or MA/Z radio buttons. You can examine one or more dots on the scatter plot by clicking and lassoing the targets using the mouse (see the figure above). You can clear the selection — and the table entries — by clicking the small red "x" in the middle of the selection in the scatter plot. The table at the bottom right of the window will display the selection. If you enter text in the Search field, only entries matching the search text (in any column) will be displayed. If the Advanced radio button is clicked, search boxes appear above each column, allowing you to search for specific items in a column by entering criteria in the column search box. The ellipsis button will enable you to choose the columns to display.
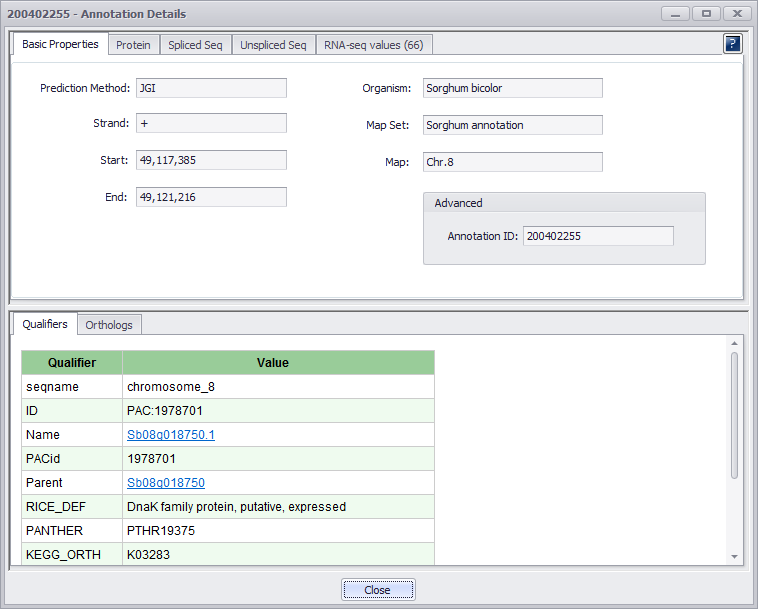
If you click the ID field, an Annotation Details window will be displayed (see the figure below). If RNA-seq values are available, the RNA-seq tab will be displayed and the RNA-seq values will be displayed in the upper panel.
If you click on the Expression Analysis button, the Expression Analysis window will come up with the RNA-seq values and metadata in a table on the left and a grayed out bar graphic on the right. See Expression Analysis for more information.
 Copyright © 2009-2024 by Persephone Software. All Rights Reserved.