Synteny
Physical Maps (Synteny)
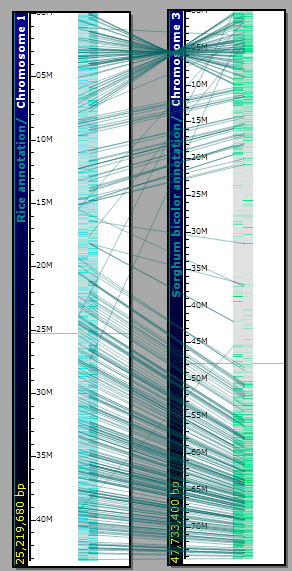
Orthologous relations can be calculated by different methods. The results of gene-to-gene mapping are stored in the database. Persephone draws connectors between orthologs, which makes it easy to see syntenic regions.
Matches between genes are ordered based on their alignment score (it could be BLAST or other algorithm of finding the match), with the best hit being ranked 1. A pair of genes from two different species will be true orthologs if both of them have the rank of 1 in the list of homologous proteins from the other species.
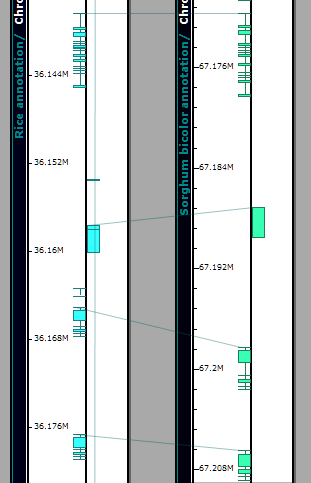
It is easy to zoom into the syntenic regions up to the exon level and see that besides the gene order, the exon structure is also conserved. You can zoom all plates simultaneously by rolling the mouse wheel over the stage area between the plates.
The connector lines can be shown/hidden by a toolbar button (View>Show Connections Between Ortholog On/Off). The transparency of connectors can be adjusted (Tools>Settings>Plate display>Connectors). (See Settings for more information.)
Please note that Persephone shows two different types of connectors:
- a single line connects orthologous genes;
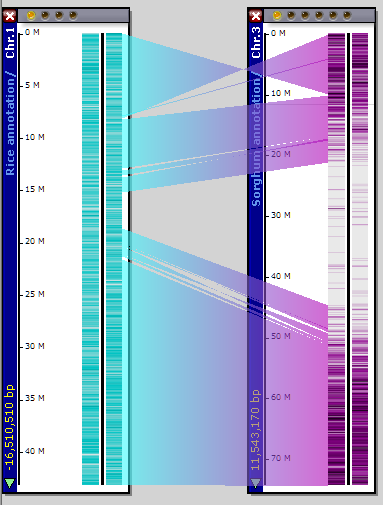
- a ribbon connects syntenic regions calculated offline and pre-loaded into the database (see picture below).
Find Synteny
To find the most syntenic chromosome from another organism based on the number of orthologs, right click on a plate and select Find Synteny from the right-click menu.

A synteny window comes up and you can select any available organism, with the number of matches displayed for each chromosome (see the figure below).
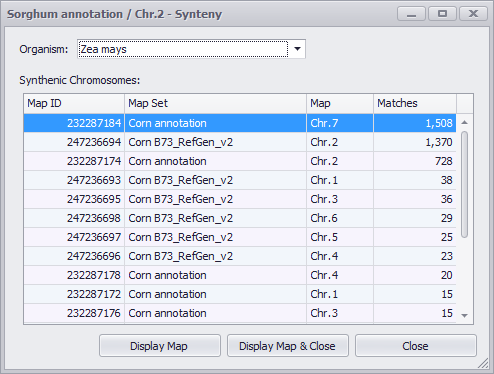
When a chromosome is selected you can display the new chromosome on the Maps tab screen by clicking Display Map or Display Map & Close (see the figure below).
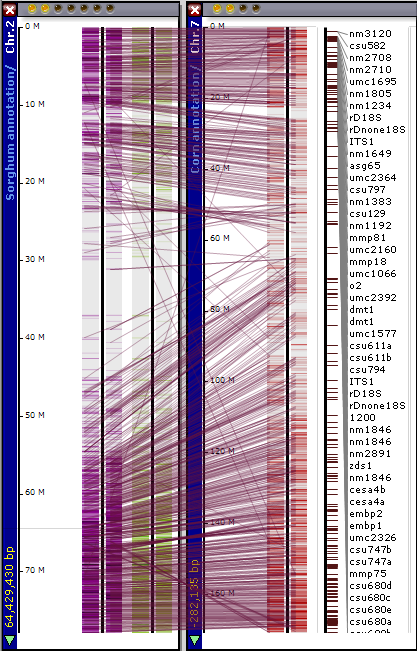
Lines link orthologous genes between the physical maps of the two organisms. You can toggle the lines on and off using the View tool and selecting the Connectors between Orthologs On/Off. The connector lines can be adjusted from a lighter to a darker value using the slider bar control in the Connectors panel at the bottom of the Plate display tab (Tools>Settings>Plate display). By zooming in you can identify the related genes at either end of the line. Clicking on the gene will open an Annotation Details window.
Tip
A second tool useful for looking at chromosomal synteny is found on the main toolbar under Tools>Synteny Matrix. It provides a pairwise comparison between the chromosomes of two genomes. Double-clicking on any pairwise comparison will yield a map like the above example. See Synteny Matrix for more information.
 Copyright © 2009-2024 by Persephone Software. All Rights Reserved.