Synteny Matrix
From the toolbar select Tools > Synteny Matrix to display the Synteny Matrix, which produces a pairwise comparison of all of the chromosomes of two different organisms. This is presented as a series of small plots of each of the pairwise comparisons of chromosomes. The physical maps of the two genomes are selected from the two Map Set selection windows on the left side of the screen. The top selection will be displayed on the horizontal axis and the bottom will be displayed on the vertical axis. The Tracks drop-down list below each map set will enable different types of data to be used as the basis of the matches. Clicking the Display Synteny button will generate the graphic. A progress window will be displayed as the individual pairwise comparisons are displayed.
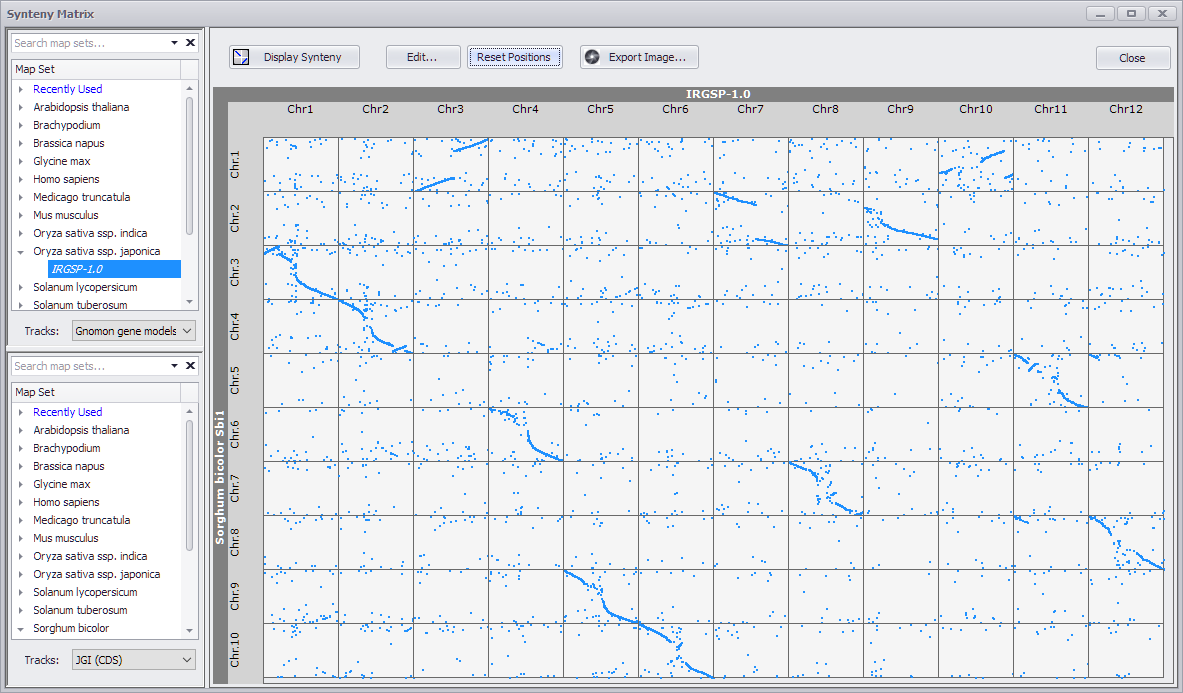
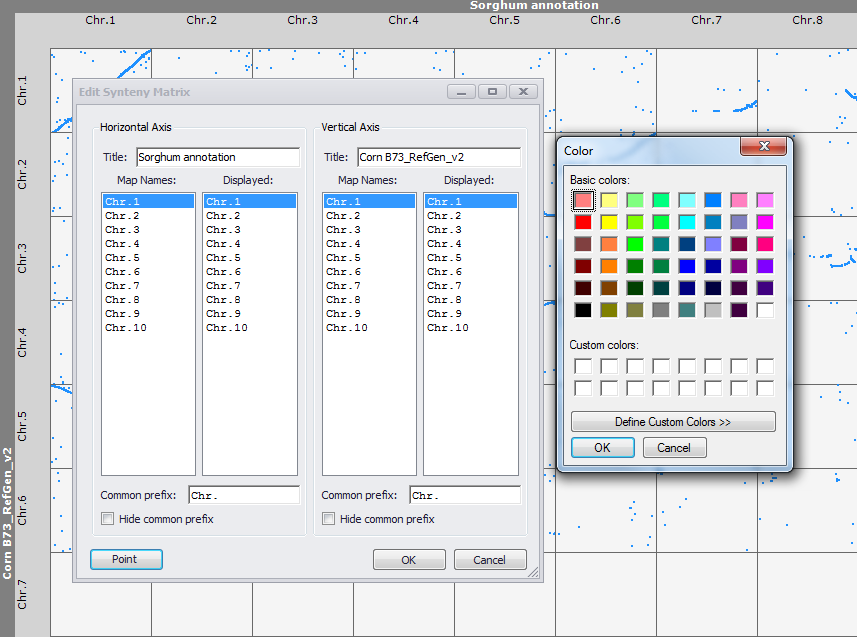
The Edit button will bring up an Edit Synteny Matrix window. You can abbreviate the chromosome label (click Hide common prefix) and change the titles of the vertical and horizontal axes. Clicking the Point button displays a color palette to enable you to change the color of the points displayed in the map. You can zoom in or out of the graphic using the mouse wheel. You can also click and drag the graphic using the mouse. Clicking the Reset Positions button will return the graphic to its original size and location.
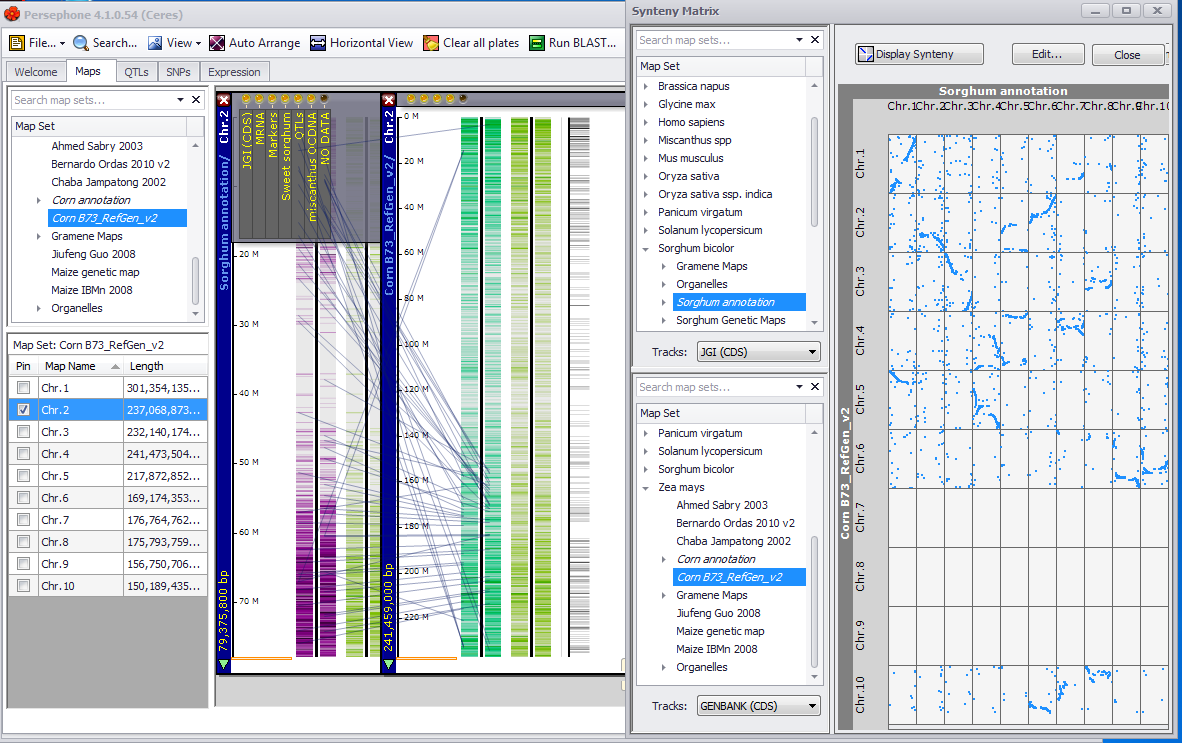
Double-clicking on one of the individual pairwise comparisons will bring up a Maps tab window with the two chromosomes displayed (see the figure below).
 Copyright © 2009-2024 by Persephone Software. All Rights Reserved.