The Toolbar
The toolbar at the top of the screen provides access to a wide variety of tools. If you hover your mouse pointer over the Search, Auto Arrange, and Clear all plates buttons a tool tip will briefly describe the function of the button.
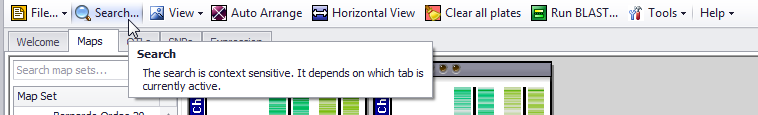
The contents of the toolbar will change depending on which tab is currently active. However, every tab retains File, Tools, and Help menus and the network latency status icon. The following figures show how the toolbar varies depending on your selected tab. The toolbar buttons are described below.
 File
File
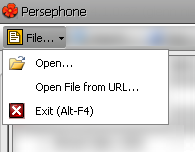
The File menu lets you import data files into Persephone using the standard Windows browser, a URL, or with FTP. It also enables you to exit the application. See Loading External Files for more information.
|
File menu |
Description |
|
|
This menu includes the following items: Open: Brings up a window that enables you to open a file from your computer. Open File from URL: Brings up a window that enables you to open a file from a URL. In addition to the URL tab, this window contains tabs for opening a file from your computer (File) or from an ftp site (FTP). Exit: Closes the application. |
Persephone recognizes several external file formats including Excel, Variant Call Format (VCF), bedGraph/Wiggle, and BLAST files.
 Search
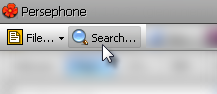
The Search menu enables a user to search by marker, gene, QTL, or map (genome, chromosome, linkage group, scaffold, etc.) information within Persephone. See Search for more information.
|
Search |
Description |
|
|
This button opens the search window. The search window enables you to search by marker (for example, a SNP or an indel variant), gene, QTL and trait, or map information. |
 Browse (QTLs Tab Only)
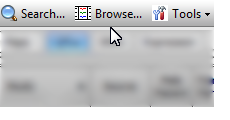
This button opens the QTL browser window. See QTLs Tab for more information.
|
Browse |
Description |
|
|
This button opens the QTL Browser window (only available on the QTLs tab). |
 View
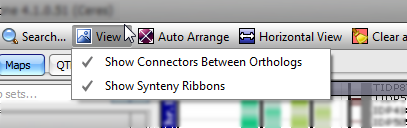
View
The View menu enables toggling between displaying and not displaying connectors between orthologs or markers.
|
View menu |
Description |
|
|
This menu includes the following items: Show Connectors between Orthologs: Click to toggle connectors between Orthologs. Show Synteny Ribbons: Click to toggle Synteny ribbons. Presently, only a few species contain this feature. |
 Auto Arrange
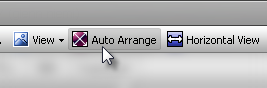
Auto Arrange enables resetting all zoom values for the displayed information and will clean up the visualization by ordering and aligning the information being viewed. This restores all information to the same zoom level.
|
Auto Arrange |
Description |
|
|
This button arranges all displayed information being viewed. All zoom values for the displayed information reset and information is sorted and aligned. |
 Horizontal View
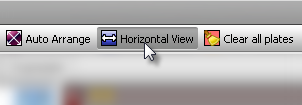
Horizontal View enables selecting of a subset or region of the vertical data track and displaying this selected region in a more granular form horizontally (capable of zooming into a single nucleotide). See Horizontal View for more information.
|
Horizontal View |
Description |
|
|
This button provides help on selecting a region to view horizontally. The vertical view provides a more macro view of information to choose a target region. The horizontal view provides finer detail enabling display down to the single nucleotide level. |
When you click on this button, a region of roughly 1 Mbp is highlighted, as indicated in the highlighted area on the leftmost section of the plate. You can also select a targeted region by holding Ctrl and the left mouse button and dragging the mouse along any sized region of the map. As you make your selection a screen tip will indicate the chromosome coordinates of the mouse pointer.
Note
If the size of the region exceeds 1 Mbp, it may be slow to load and display in the horizontal format.
Once a region is selected, a screen tip will indicate the size of the region selected. Click on the arrow and the selected region will be displayed horizontally with all information retained from the vertical view.
 Clear all plates
The Clear all plates button will remove all information on the stage. A progress bar over the button will appear until the information deletion is complete. A progress bar is used so that accidental removal of information from view is less likely.
|
Clear all plates |
Description |
|
|
Click and hold this button to remove all information from the screen. |
Note
It is required to hold the button continuously for about one second to prevent accidental removal of information from view.
 BLAST
BLAST
BLAST performs a quick search of a DNA or a protein query sequence in the selected genome. See Run BLAST for more information.
|
Run BLAST |
Description |
|
|
Click this button to run the Basic Local Alignment Search Tool (BLAST). |

 Bookmarks
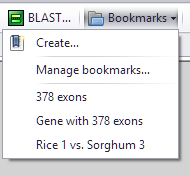
|
Run BLAST |
Description |
|
|
Click Bookmark menu item to open a submenu that includes: Create... : Create a new bookmark. Manage bookmarks...: Modify/delete/open existing bookmarks. [saved bookmarks]: Open saved bookmarks in one click - select an item from the menu of recent bookmarks. |
The Tools menu consists of a wide variety of features for configuring the look and feel of the application (such as plate display and general display parameters) as well as displaying and extracting data from Persephone. See Tools and Settings for more information.
|
Tools menu |
Description |
|
|
This menu includes the following items: Add-ins: Coming soon. Settings: Configure how information is displayed and system settings. See Settings for more information. Synteny Matrix: Compares the genome information of two different species. The results are displayed through a series of dot-plots of each pairwise ortholog match. See Synteny Matrix for more information. Compact View of Genetic Map: Creates a simple map of different types of markers for a species. See Compact View of Genetic Map for more information. Generate Fasta File for a List of ANNOT_IDs: Opens the Generate Fasta For List of Genes window. Enables entry of annotation IDs of sequences (manually entered or from a file) and fetches the corresponding FASTA-formatted sequences. See Generate Fasta File for a List of ANNOT_IDs for more information. Get Marker Details for a List: Provides information on one or more markers. You can enter marker names manually or from a file of marker names (one per line in either case). Select to display a Get Details button that produces a list of markers and associated information. You can filter and sort the results. See Get Marker Details for a List for more information. Trait Ontology Browser: Opens the Trait Ontology Browser. See Trait Ontology Browser for more information. Get Details for the Feature List: Opens the Get Details for the Feature List window. Enter or copy-and-paste keywords to search genes, traits, or markers. See Get Details for the Feature List for more information. |

 Help
Help
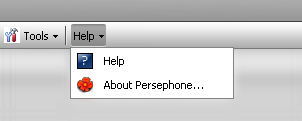
Clicking on Help will display two menu selections: About Persephone and Help.
About Persephone provides licensing, software version #, and third-party software use information.
Help opens the on-line help documentation in a new window.
|
Help menu |
Description |
|
|
This menu includes the following items: Help: Opens the online help. About Persephone: Displays a screen containing license information, software version #, and third-party software |
Note
Additional help (identified with a blue, square icon containing a question mark) is located throughout the program taking you to specific sections of the on-line manual or providing additional information for a specific topic in a pop up window.
 Network
At the far right of the toolbar is the Network icon which provides network latency information between your desktop client and the API server or database where the data is stored. Green bars indicate low latency leading to fast performance of the application; whereas, red bars indicate high latency where performance of the application will be slower. If you hover the mouse pointer over the icon, a tool tip with the name of the API server and database will appear with the network latency (in milliseconds) displayed for each. Additional options for settings are available at Tools> Settings and then System tab.
See Settings for more information.
Tip
Shift-click on the Network icon to refresh the data.
 Copyright © 2009-2024 by Persephone Software. All Rights Reserved.