VCF Files
Importing a VCF file, either raw (.vcf) or compressed (.gz), will open the Vcf Manager window (shown below). VCF files can be opened by dragging and dropping them into the main Maps page or by selecting them using the File tool on the main toolbar. The data must be indexed for performance reasons and associated with a map set before they can be viewed. As the data is loaded, the SNP Count in the VCFs panel will increase and a progress bar with percent completion will appear in the VCFs panel at the top of the window in the Message field. In addition, a text message under the lower panel will also report on progress. After the data is loaded, both the Message field in the VCFs panel and the area below the Genotypes panel will show "Ready". You will be required to select a map set in order for the data to be viewable.
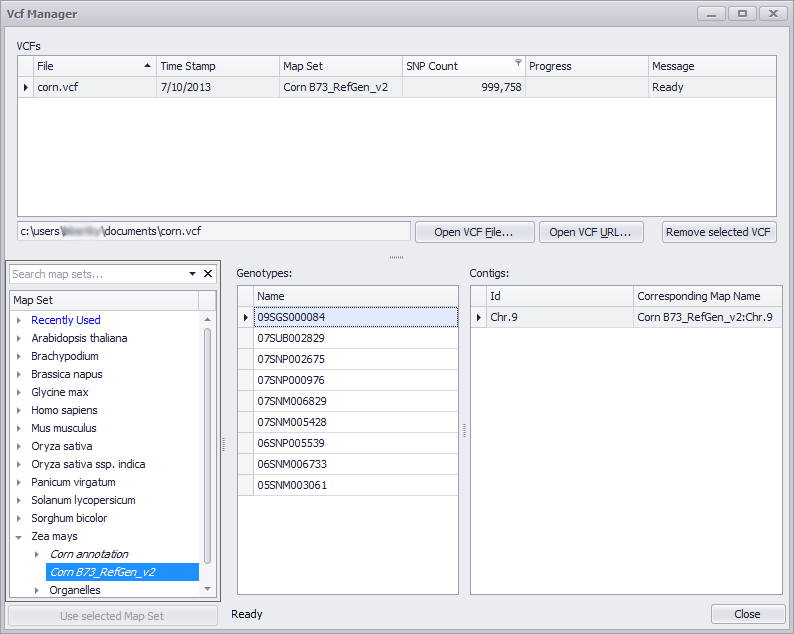
After the indexing is finished the user has to select a map set that will be used to display SNPs from the VCF file. First, select the VCF file from the list, then highlight a map set from the map set tree and click the Use selected Map Set button. This will assign the VCF file to a map set.
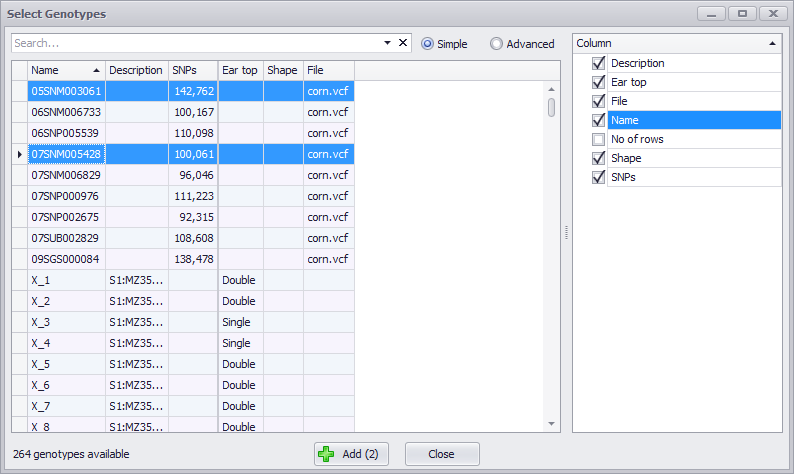
You can select the new data by the Name: Click for one row, Ctrl-Click to select multiple contiguous or non-contiguous samples, or Click on one row and Shift-click on a second row to make a contiguous selection (all intervening rows). The rightmost panel is a checkbox menu to enable you to select the columns to be displayed. The File column should display the original VCF file name you imported.
If you click the Add button (which will have the number of selected genotypes in parentheses), a series of chromosomal maps will be displayed in the lower half of the screen along with a label indicating the genotype. Three data tracks will be shown (see the figure below) for each genotype: SNPs identical to the reference genome (blue), SNPs different from the reference genome (red), and heterozygous SNPs (green). A tool tip will be displayed if you hold the mouse arrow over a data track indicating the genotype and type of data track.
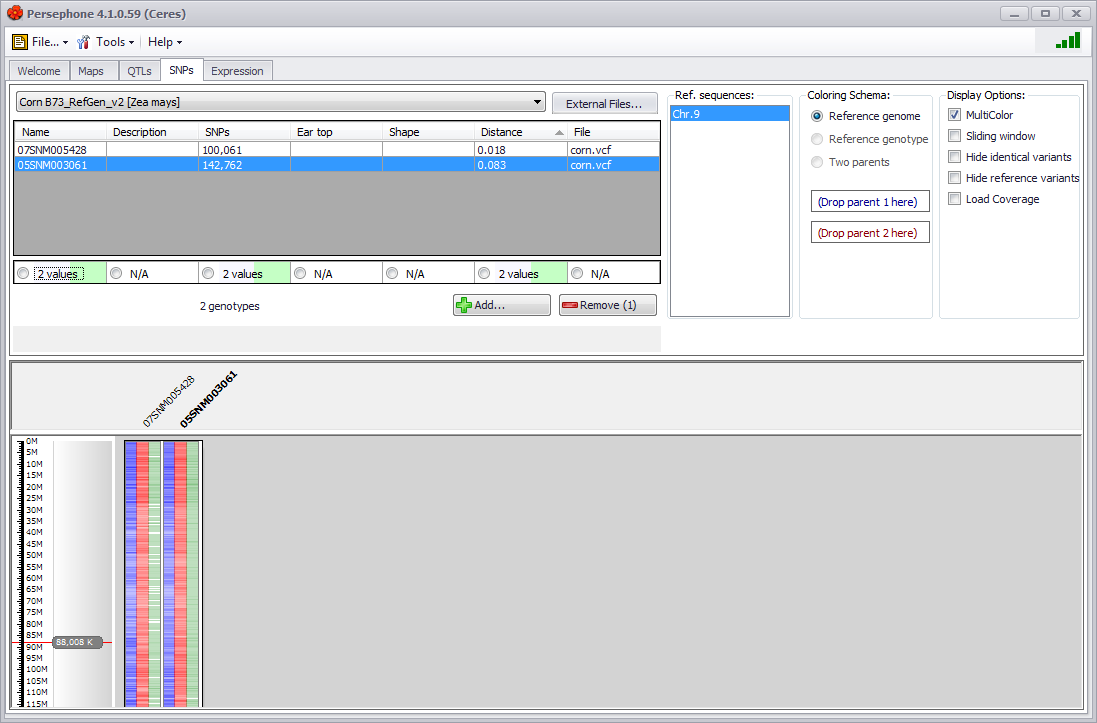
You can add additional data with the Add button or remove a selected row(s) of data by clicking on the Remove button. You can change the chromosome displayed by changing the selection in the Ref. sequences menu and multiple chromosomes can be displayed using Ctrl-click. The chromosomal graphic can be customized using the Display Options on the right of the upper panel. See SNPs Tab for a detailed explanation of the Display Options.
Clicking on the graphic will open the appropriate map from the selected map set in the Maps tab. The same three tracks of data will be displayed for each genotype name selected (see the figure below).
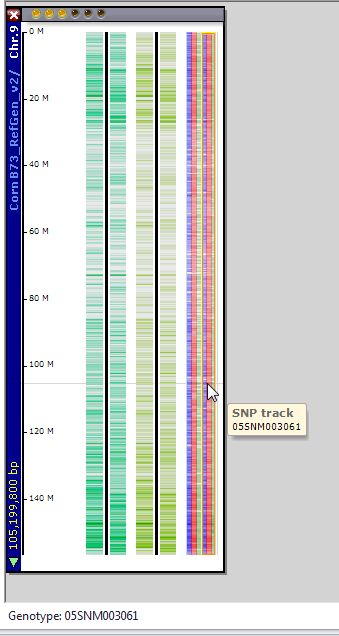
Please refer to SNPs Tab for the further analysis of these SNPs.
 Copyright © 2009-2024 by Persephone Software. All Rights Reserved.