Web Persephone: MultiMap
MultiMap
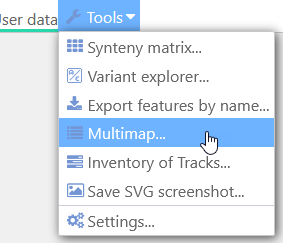
Persephone's MultiMap mode can display multiple connected maps on the same screen in a compact view. The maps can be connected by common markers or gene orthologs, and MultiMap makes it easy to find maps of interest that can be aligned to a single reference map as well as to each other. To begin, select Tools|MultiMap from Persephone's main toolbar to open the main MultiMap dialog:
The MultiMap Dialog
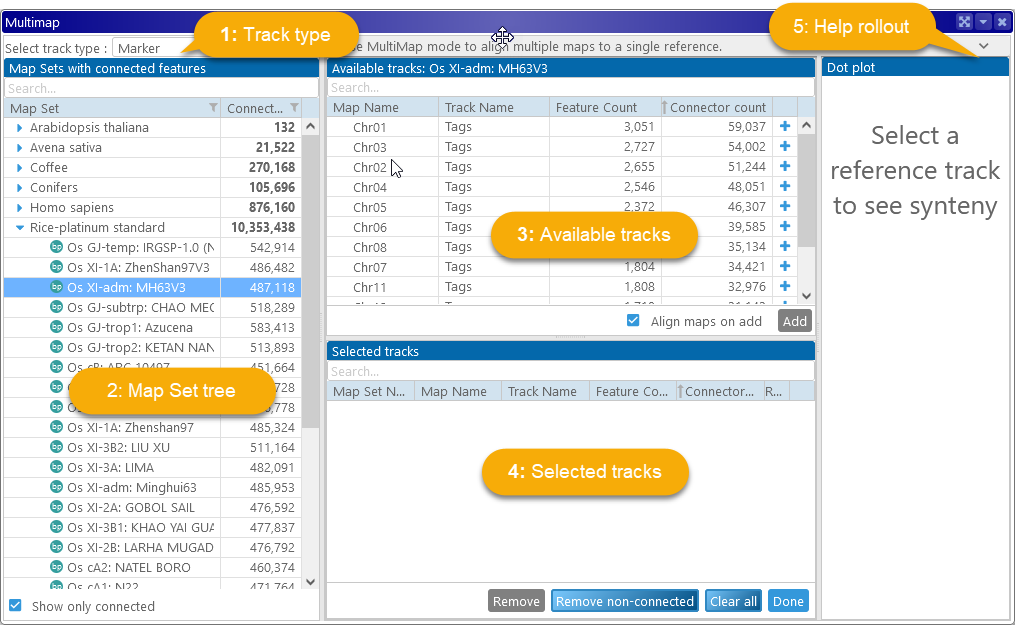
1: The track type dropdown: Determines what features Perspehone should use to connect the maps: markers or gene orthologs (annotation tracks). In this example, markers are selected.
2: The map set tree: Displays the list of available map sets, with a counter displaying the approximate number of available connectors for each map set. You can uncheck the Show only connected checkbox (at the bottom) to display all map sets, even those without any available connectors: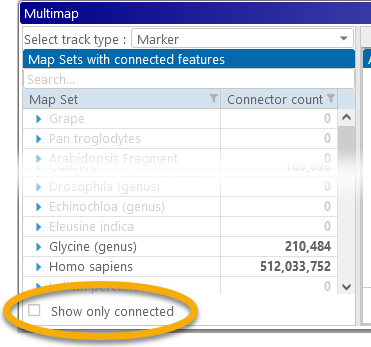
3: The table of available tracks: shows all available tracks for the currently selected map set. In this example, the Rice Nipponbare reference map set is selected, and all of its marker tracks are listed in the table, along with the number of track features and available connectors for each track on each map.
4: The table of selected tracks: Lists all the currently selected tracks. At the beginning, the list is empty, as no tracks are selected and no maps are open in Persephone; any currently opened maps will be automatically listed here.
5: The help rollout: You can click this button to expand or collapse a help popup, which serves as a quick reference for the main MultiMap functionality. You might want to keep it collapsed to win some space.
MultiMap with markers
To illustrate MultiMap functionality, we will use the Tags track on the rice pangenome. This track contains markers that were created by PersephoneShell by mapping short sequence fragments across the entire pangenome. To start with, let's select Chromosome 1 of Nipponbare as the reference map. To do so, select the map in the table and click Add, or just click the  button next to the map (you can also select multiple maps and add them all at once). The map will move from the table of available tracks at the top to the table of selected tracks at the bottom.
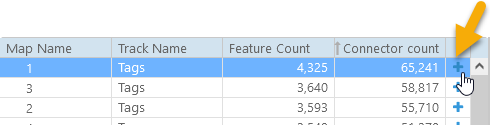
Because this is the first map that has been selected, it will be automatically chosen as the reference, and the map set tree will rearrange itself to display only those maps that can be connected to the reference by their markers: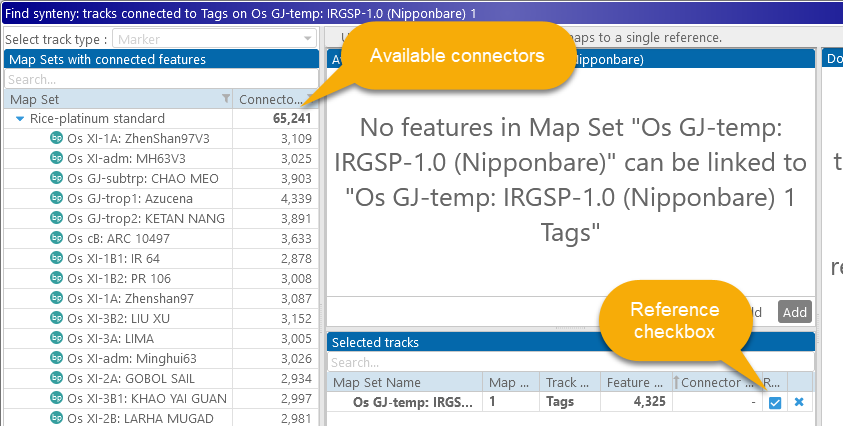
The prompt in the table at the top now indicates that no maps in the selected map set can be linked to the reference map. Let's select one of the other varieties of rice in the pangenome, e.g. Chao Meo:
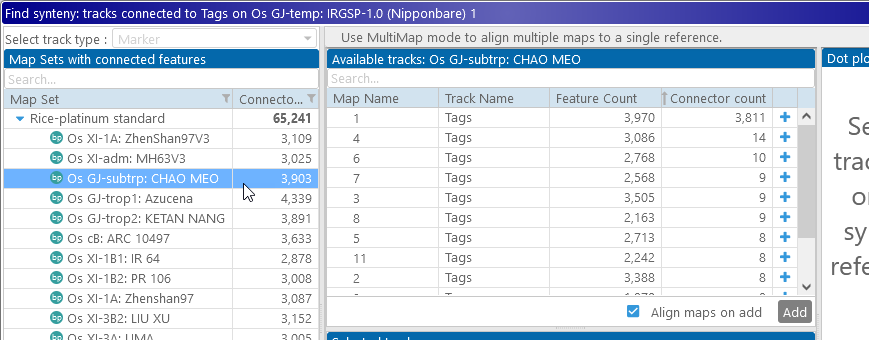
The table of available tracks now lists all possible tracks that can be connected to our reference track. By default, these are sorted by the total number of connectors; as expected, Chromosome 1 of Chao Meo is the best match to our reference (Chromosome 1 of Nipponbare), with 3,811 connected markers. Let's add it to our view:
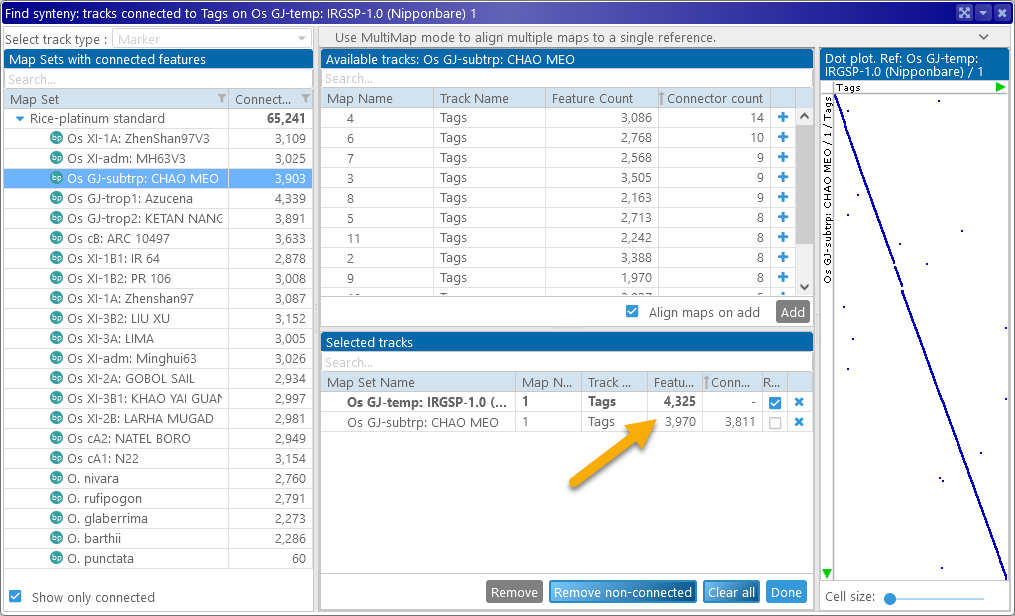
The reference map is always shown in bold at the top of the table. The dot plot on the right side of the dialog displays a preview of all the markers that are mapped to both the reference and the newly selected map (similarly to the Synteny Matrix). The X-Axis represents the features on the current reference map, and the Y-Axis represents the features on all the other maps. You can add as many maps as needed; as new maps are added to the MultiMap selection, they are also added to Persephone's map stage.
MultiMap display mode
When MultiMap is enabled, newly opened maps are shown in compact mode. All of their tracks are hidden, except for the track that is used to display connectors (in this example, marker-to-marker connectors); the header of the currently selected reference map is highlighted in green and gold. The green control panel at the top of the stage provides additional display options:
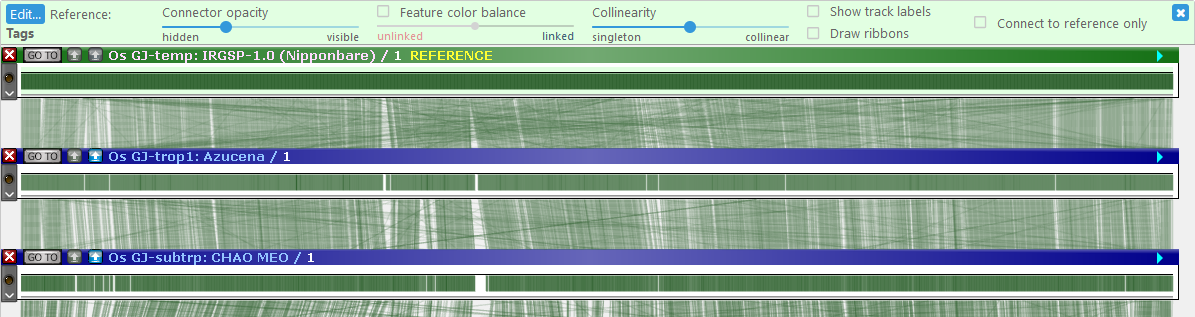
- Edit: Re-opens the MultiMap Dialog if it was closed.
- Reference: Shows the name of the current reference track.
- Connector opacity: Use this slider to make connectors more opaque (if they are difficult to see) or more transparent (if they are getting in the way of other information).
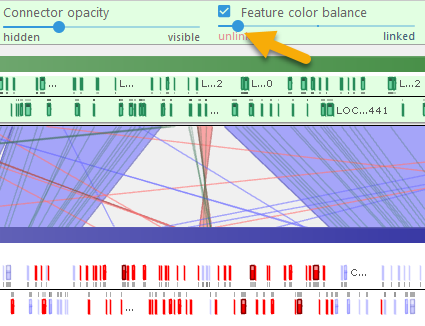
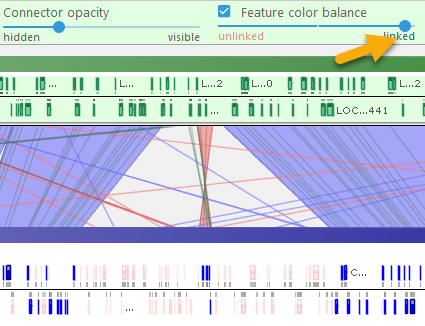
- Feature color balance: When the checkbox is checked, moving the slider all the way to the left will emphasize those features (e.g. markers) that did not match the reference; moving the slider to the right will emphasize matching features. For example, you can use this slider to emphasize the presence/absence of orthologous genes on different varieties of Coffee:
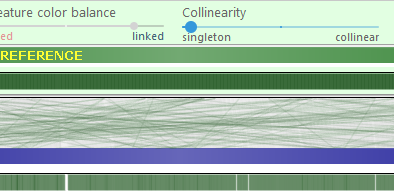
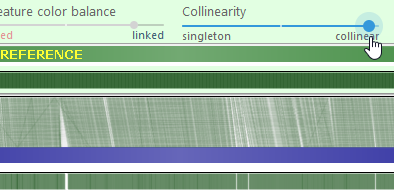
- Collinearity: Moving the slider to the left will emphasize non-collinear connectors, e.g. those representing translocations. Moving the slider to the right hides such connectors
- Show track labels: Shows track names and statistics on top of each map; these are hidden by default to save space.
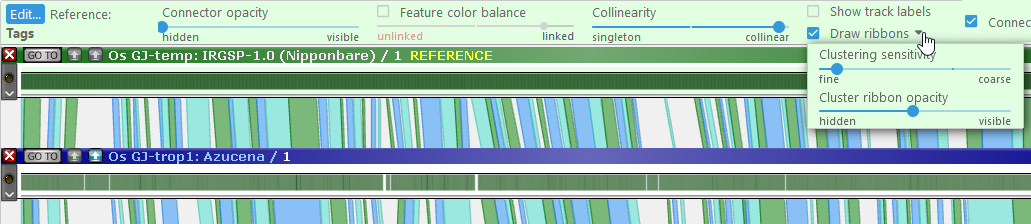
- Draw ribbons: When this checkbox is checked, connectors will be automatically clustered into ribbons, thus making their patterns easier to see. Use the dropdown menu to control the clustering fidelity (fine to create many small ribbons, and coarse to aggregate such small ribbons together). When displaying ribbons, you may also wish to turn down Connector opacity:
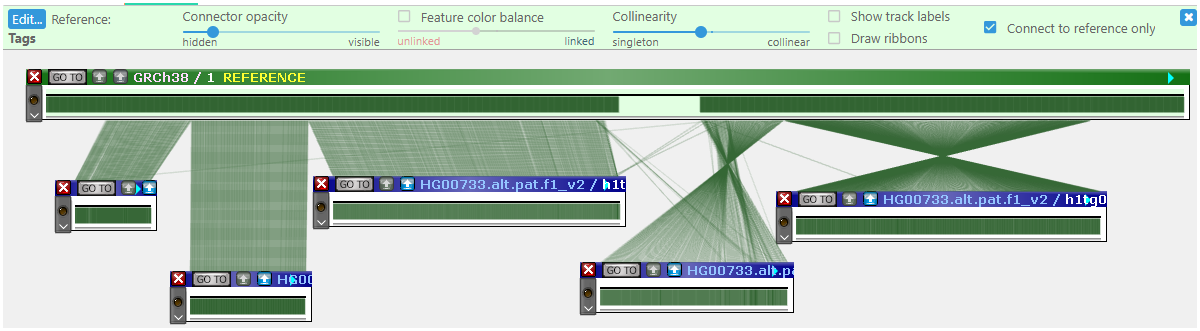
- Connect to reference only: By default, neighbouring maps are connected to each other, making it easier to track conserved blocks across the pangenome. You can also connect all of the maps directly to the reference; this can be useful when aligning scaffolds against the reference assembled chromosome.
You can return to the MultiMap Dialog at any time by clicking the Edit button in the upper-left corner of the green; you can also exit MultiMap mode by clicking the  button in the upper-right corner of the control panel.
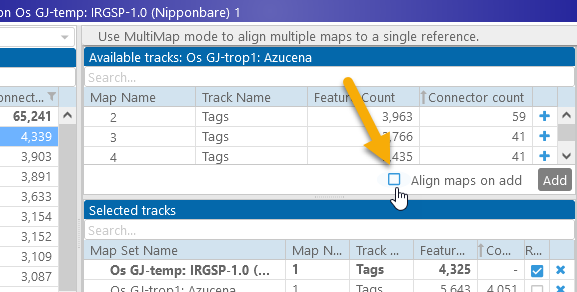
Note that when new maps are added to the view, all existing maps are auto-arranged: they are sorted vertically by their proximity to the reference, and aligned horizontally to keep most of their connectors straight. To turn this behaviour off, uncheck the Align maps on add checkbox in the MultiMap Dialog:
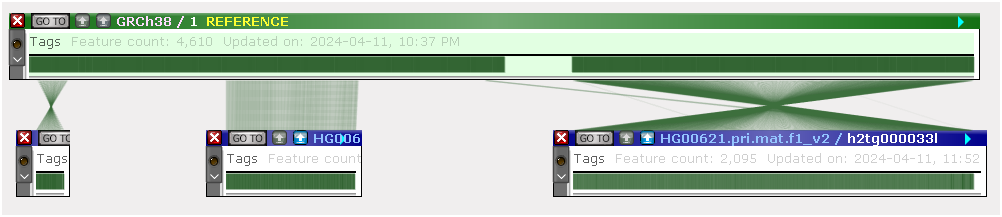
You can still manually auto-arrange all of the maps by clicking the Auto arrange button on Persephone's main toolbar. All of the maps will be placed in their best-fit positions relative to the reference:
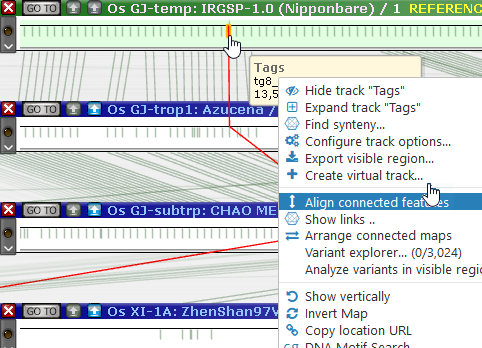
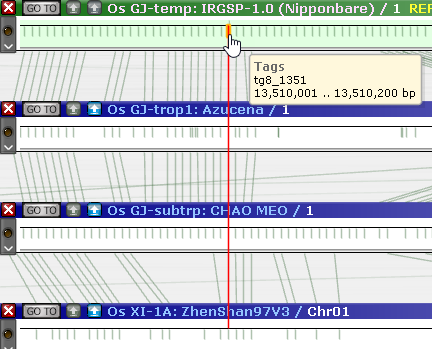
As always, to zoom in all of the maps together, place the mouse anywhere on a blank spot between the maps and roll the mouse wheel. You can also right-click a connected (!) marker and select Align connected features from the popup menu to scroll and zoom all of the maps around the highlighted feature across the entire pangenome:
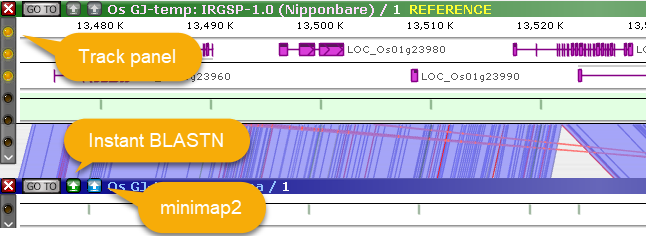
As always, you can click one of the sequence alignment buttons to run minimap2 or (assuming you are zoomed in close enough) Instant BLASTN. You may also wish to use the Track Panel to display some of the hidden tracks; for example, you could display the GC-content track as well as gene annotations on the reference:
Find synteny
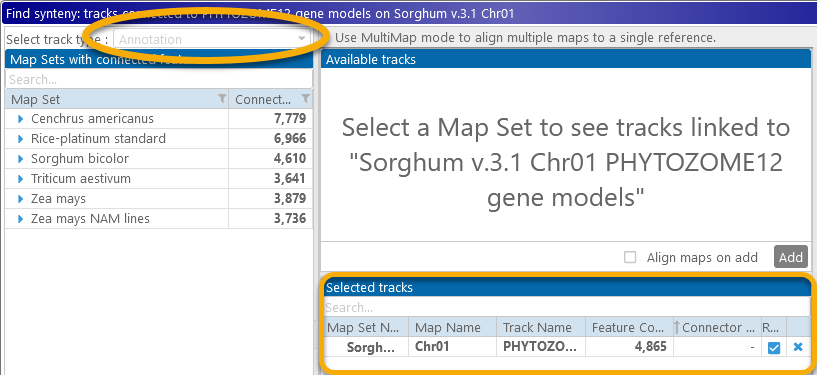
You can also get to the MultiMap dialog by right-clicking a track, and selecting Find sytnteny from the pop-up menu. For example, let's open the first chromosome of Sorghum, and right-click the PHYTOZOME 12 gene annotation track:
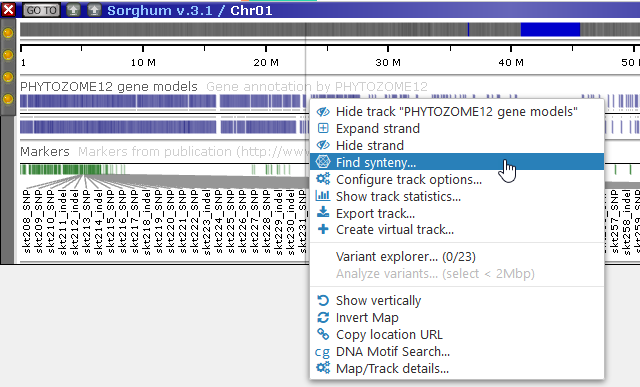
The MultiMap dialog will appear in Annotation mode, with the gene annotation track pre-selected as the reference:
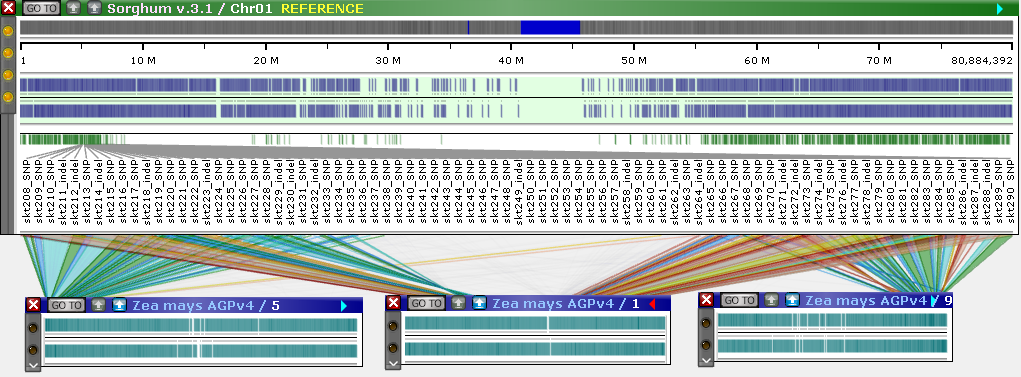
In Annotation mode for MultiMap, gene annotations are displayed on two strands (as usual), and connector lines are drawn between orthologous genes, but all other MutliMap functionality remains the same as in Marker mode:
 Copyright © 2009-2025 by Persephone Software. All Rights Reserved.