Excel Files
An external Excel (or tab- or comma-delimited text) file should have a header row. The names for the columns in the header row will be ignored by Persephone, but what is important is the number of the columns in the header. If, for example, you header has 3 columns and the data has 6 columns, only three columns of the data will be read.
The first three columns are required: Map name, Feature name and Start position. Three more columns are optional: End position, Track name and Feature color.
Below is an example of this format with 6 columns displayed in Excel.
 ,
,
or in the CSV format:
map,marker_name,start,end,track,color
Chr01,positive1,190110,190120,ROI,blue
Chr01,negative,190140,190130,ROI,red
Chr01,positive2,190510,190820,ROI,#0066ff
Chr01,positive3,190810,190920,ROI,blue
The color values in the sixth column can be provided by three different methods:
- by using the name of the color, like Red or green (case insensitive). Please consult this page for the complete list of names
- by providing the HTML code for color, for example #FFFF00
- by specifying RGB values separated by comma: 255,0,255
Excel files can be opened by dragging and dropping them onto the main Maps page or by selecting them using the File menu on the main toolbar. When Persephone opens the file, its name is displayed under the External Data node of the tree on the left, and an Open File window is shown. When the status is listed as "Complete" and a short text message at the bottom left of the window reads "File loaded successfully", you can select the maps to display:

The external file with marker maps can be shown "unlinked", without being aligned with the data from the database. In this case, leave the map set tree node "Unlinked Data" selected and click on one of the maps in the lower part of the form. To select more than one map, hold Ctrl key on the keyboard. Click "Show Selected Maps" to display the maps on the main stage.
When used with "Unlinked Data" option, the type of the map will remain unknown, which will be shown as a gray title bar on the map:

Persephone would know the type of the map only if the tracks are displayed on the maps coming from the database.
To attach the external data to the the maps read from the database, select one of the map sets from the map set tree on the left.
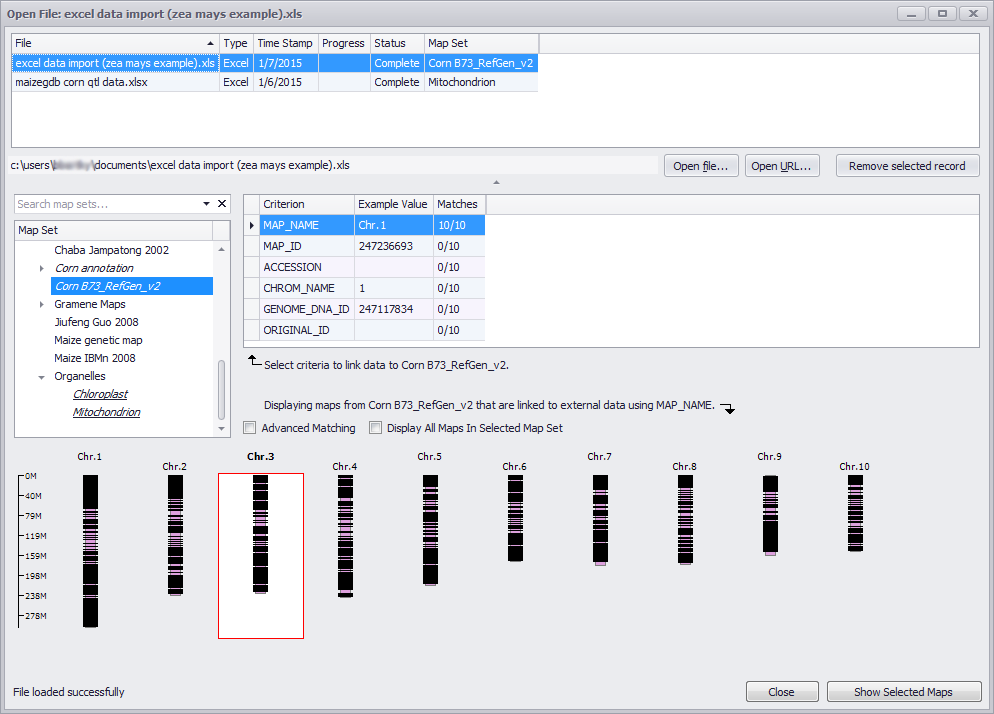
The matches will be displayed in the center window. The little arrow sign will show the criterion used for linking the imported data to the selected map. The selection can be moved up or down the table to change the criterion for linking. Clicking on the Advanced Matching checkbox will display linking on a chromosome-by-chromosome basis. At the bottom of the page, you can select the chromosome to be displayed by clicking on an individual chromosome. You can Ctrl-click on additional chromosomes or Shift-click on a second chromosome to add a contiguous group of chromosomes to the selection to display.
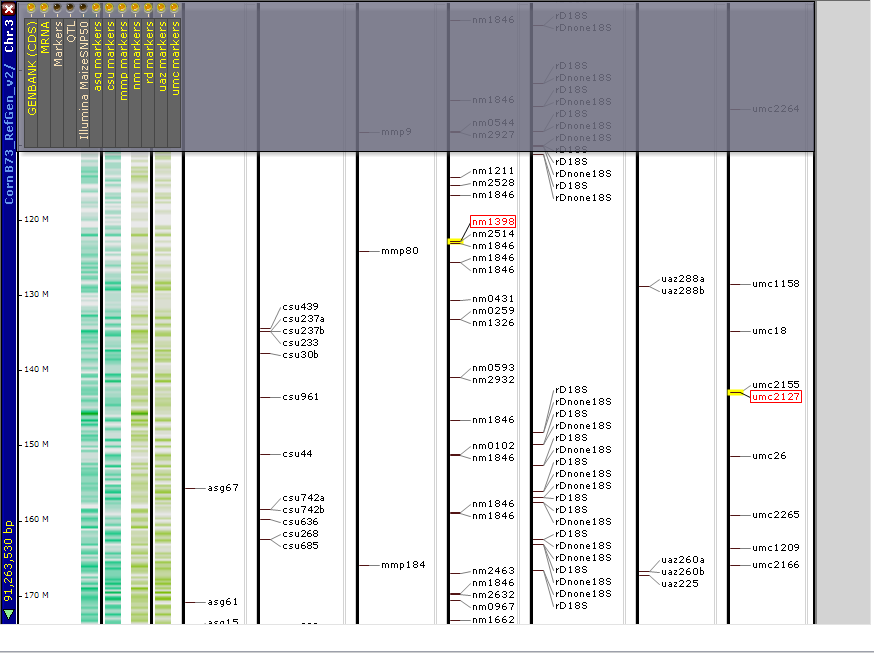
Click Show Selected Map to display the chromosome(s) as shown in the example below.
 Copyright © 2009-2024 by Persephone Software. All Rights Reserved.