Viewing SNP Details
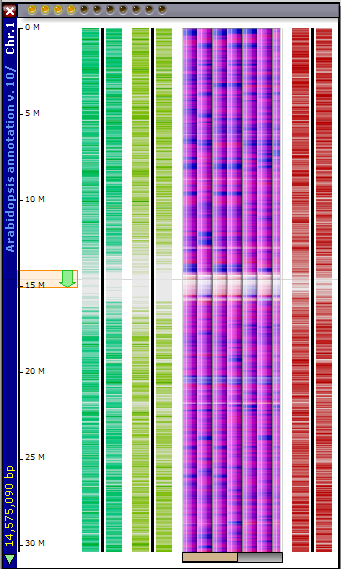
If you click on the chromosomal graphic, a map tab window is opened with the appropriate chromosome map and SNPs data tracks displayed (see the figure below).
In order to view SNPs at the nucleotide level, you will need to move to horizontal view (see the figure below) and zoom in until a sequence is displayed in the lower right window along with the SNPs for each of the studies (if they are present in the very limited region of course!). If the magnification of the sequence is sufficiently high, you can select a specific SNP and right click for a context menu. The two menu selections at the bottom of the right-click menu enables you to either Generate Translations for Gene or Design SNP assay. If you are not in a gene sequence, the Generate Translations for Gene will be gray and unavailable for selection.

The zoomed view contains some additional information about the read coverage:

The numbers on the right indicate absolute count of NGS reads per nucleotide. The color area plots those numbers using two scales: a darker color corresponds to values based on the global scaling. If some place in genome has unusually high number of reads, the other regions when shown with global normalization would look really thin. To improve visibility, Persephone also plots the coverage values based on the local scaling, where the magnification is based on the displayed region selected for the horizontal view. This locally-scaled values are shown with a lighter shades of color.
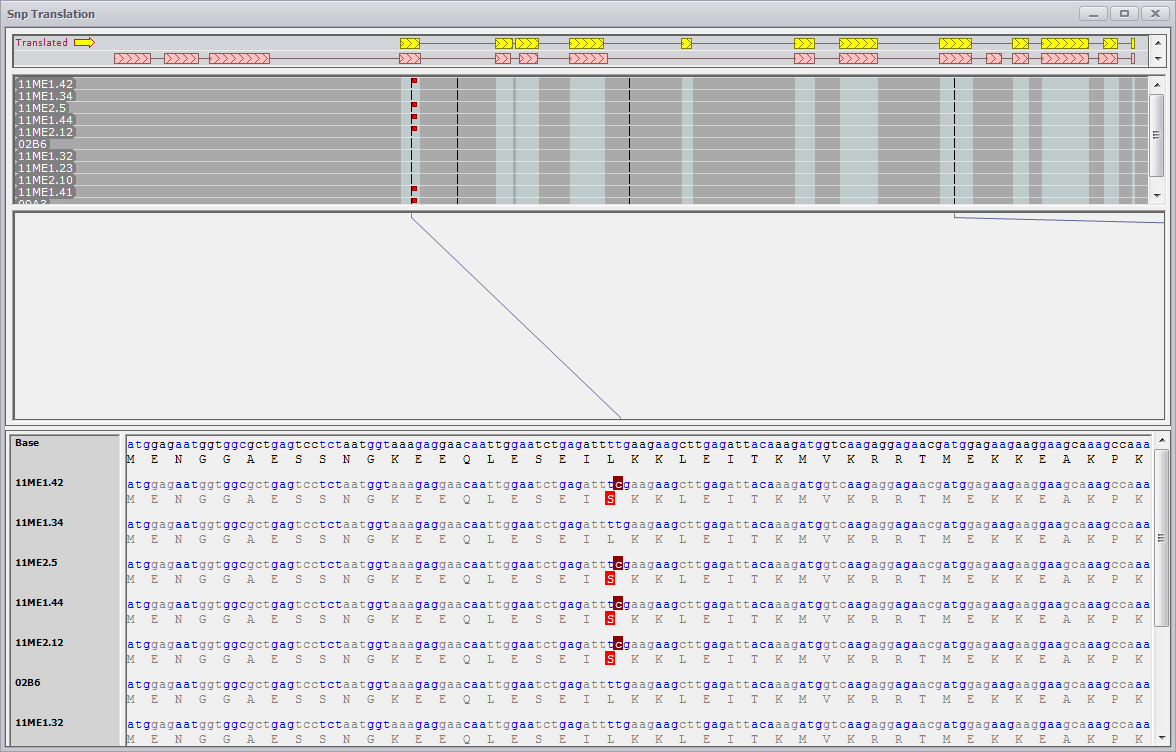
Generate Translations for Gene
If you select Generate Translations for Gene, a SNP Translation window is generated. The translation models for the reference sequence are shown at the top and the SNP sequences panels are shown just below the translations. The nucleotide sequence and amino acid translation of the gene and each of the SNP data studies will be generated for each of the SNP tracks as well as the reference gene sequence (labeled "Base"). A line spanning from the upper panel tracks at the top to the lower panel with nucleotide sequences and translated sequences below identify any of the SNPs. In the nucleotide sequence, the SNPs are highlighted. If there is a change in the corresponding amino acid sequence, the altered amino acid will also be highlighted.
 Copyright © 2009-2024 by Persephone Software. All Rights Reserved.