Display Options
The Display Options panel provides several radio button selections for the display of the chromosomal graphic and are described below.
Highlighting Top Panel Column Values by Color
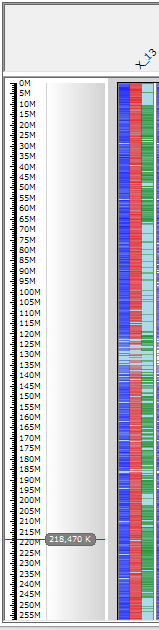
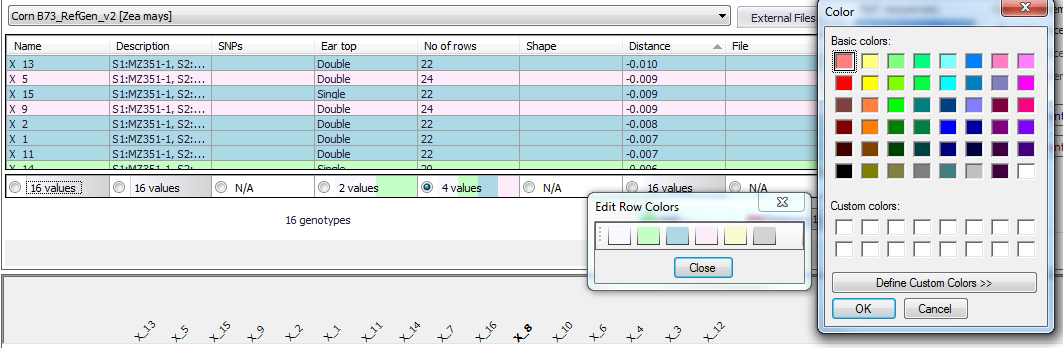
If a column in the top panel has more than one value you can highlight the values by checking the radio button at the bottom of the column as shown below. This will assign the same color to rows with the same value. In the example below all rows with the value of "22" have been colored blue.

Highlighting the top panel column values will also overlay the color on the genotype in the bottom panel. For example, in the figure below the color blue was assigned to rows with the value of "22" in the "No of rows" column in the top panel. The color blue was then overlaid on the "X 13" genotype in the bottom panel.
To remove the row color right-click on the column in the top panel and then select Remove Row Colors. To modify a color right-click on the column in the top panel and then select Edit Colors, which will open the Edit Row Colors window. Click the color you want to modify, which will open a color palette as shown below.
MultiColor
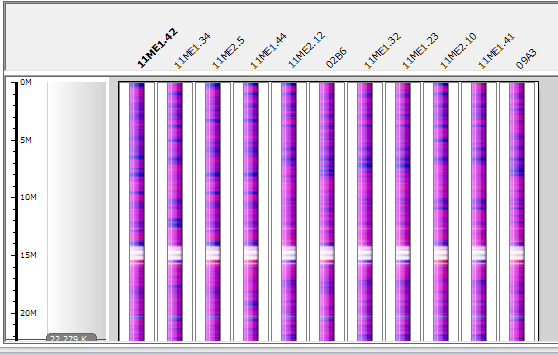
If the Sliding window checkbox is selected, the color of blocks can be assigned by two methods. If MultiColor is unchecked, the color of the block is determined by SNPs that have a majority in the block. For example, if there are 7 blue SNPS and 8 red SNPs, the color of the block will be red. If the MultiColor option is checked, the palette for coloring the blocks will have more halftones. This will reflect the actual numbers of SNPs of different kinds. So in case when the distribution of types of SNPs is close, the color will be almost gray.
Sliding window
To smoothen individual SNPs into easily visible blocks check the Sliding window checkbox. The color of blocks will depend on which SNP type is predominant in a block of 15 SNPs. Again, the blue shade will correspond to SNPs identical to the reference.
Hide identical variants
Hides SNPs at a particular location if all genotypes are identical.
Hide reference variants
Hides SNPs that are identical to the reference sequence.
Load Coverage
The coverage data show how many sequence reads are aligned to every nucleotide position in the genome. To accommodate a large range of values (from 2 to >106 reads) the coverage chart uses a logarithmic scale. If the Load Coverage checkbox is selected, a series of coverage sub-tracks will be appended to the right of the set of all genotypes. Their order will reflect the order of the genotypes on the left. Each coverage sub-track has two parts: one (brown) for maximum and the other (violet) for average coverage value for each bin of 60,000 bp.
Advanced Genotype Browser
If you click the Advanced button at the top of the Select Genotypes window, the entry field for the Simple search mode is hidden. A column-specific filter entry field is displayed just under each column field name. If you enter text in a column filter, only those columns containing the text entry will be displayed. Columns can still be sorted by clicking on the column name. You can group samples by selecting a column name and dragging it into the box above the results table. Dragging multiple column names into the box will create hierarchical groupings. The hierarchy is established by the order in which the column names are dragged into the box with the first column name at the highest level of the hierarchy. The hierarchy can be changed by dragging the column names to the left (higher level) or to the right (lower level) in the box.
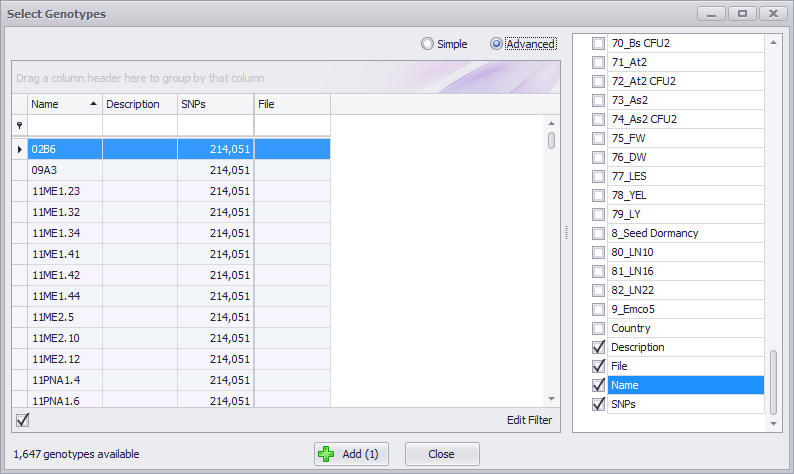
An Edit Filter button is displayed at the bottom right of the window in Advanced mode. This lets you to create much more complex filters when needed. It can be used in conjunction with the filtering options previously mentioned. See Using Advanced Filters for more information on using this editor.
 Copyright © 2009-2024 by Persephone Software. All Rights Reserved.