Web Persephone: Table Controls
Persephone presents a lot of information in the form of tables (also known as "grids"). These tables support standard sort, search, and filtering controls. In addition to the shortcuts described below, all of these options are accessible via the table's context menu.
For example, here's a typical table that contains Annotation qualifiers:
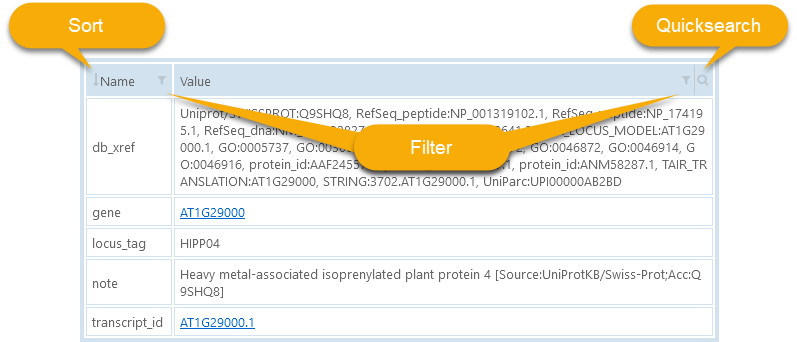
 Sort: Click the sort on the left side of the column header to sort the table by that column (you can also click the column header's text, in this case "Name"). Click again to reverse the sort direction (the arrow
  will point upwards when sort order is reversed). Click again to return to default ordering; the arrow will disappear in this case (but you could always click a column header to sort the table by that column once more).
 Quicksearch: Click the search icon in the upper-right corner of the table to bring up the Quicksearch Bar:

As soon as you start typing inside the quicksearch bar, the table will contract, hiding all rows that do not contain the text you typed. The remaining rows will highlight the search hit in orange:

Click the  icon in the upper-right corner (or press the Esc key) to close the quicksearch bar and return the table to its normal appearance.
 Filter: Click the filter icon in a column to open up the advanced filtering controls for that column; these are described below.
Advanced column filtering
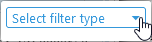
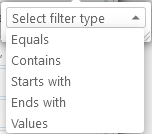
Click the filter icon to display a dropdown box listing available filtering options for that column:
Columns that contain text (i.e. non-numeric strings) support string filtering options:
For example, you can quickly find all rows whose "Value" column starts with "AT1":
As usual, you can click the  icon to clear the filter and return to the full view of the table.
Check the Not checkbox to invert the filter. Now it will match all rows whose "Value" does not start with "AT1":
This option can be especially useful when exporting tracks; for example, you could easily find all annotations whose proteins don't start with "M":
The last option, Values, displays a list of all distinct values for the given column:

You can drag the sizing handle in the bottom-right corner to make the window larger (if needed). In this example, the column ("Map Set name") contains only 2 unique values, but "Cara_1.0" occurs 3 times (meaning that three rows have that value for the "Map Set name" column). By default, all the values are checked. You can uncheck individual values to hide the corresponding rows; alternatively, you could click the checkbox in the upper-left corner, then check only the values you're interested in. For example, you could find only those rows whose "Map Set name" is "Ceug_1.0":

Numeric columns support a slightly different set of filtering options, dealing with numeric ranges (although they still support the Values filter):

When filtering numeric columns, comparison operators are drawn on top text entry boxes to clarify whether the numeric ranges are inclusive or exclusive. For example, this filter will find all track features whose Start position is strictly greater than 100,000 and strictly less than 200,000:
If you invert the filter (by checking the Not checkbox), it will now find all track features whose Start position is less than or equal to 100,000, as well as those whose Start position is greater than or equal to 200,000:
Grouping columns
Some columns can be grouped by, as indicated by the  button in the column header. Click the button to group table rows by the value of the column:
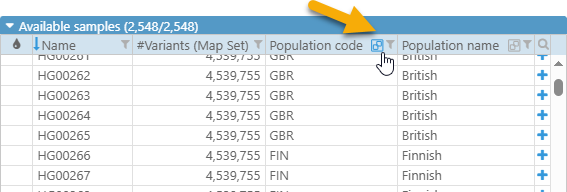
The column will move to the leftmost edge of the table, and the button will change its appearance to  , indicating that the column is now grouped:
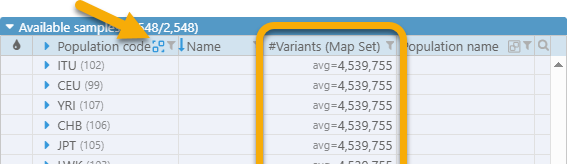
The total number of rows within each group is shown in parentheses after its column value, i.e. in this example there are 102 rows in the "ITU" group. Depending on the table, averages may be calculated for numeric columns within the group, as shown in the example above.
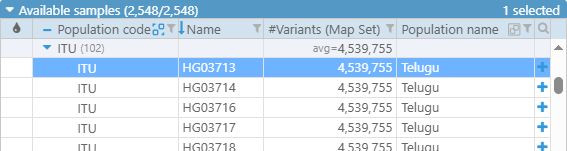
Click the  button next to a group to expand it, revealing all the rows inside (as usual, the button will change to
  , and you can click it again to collapse the group):
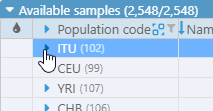
You can also click the group's header to quickly select all the rows inside it; this works even if the group is collapsed.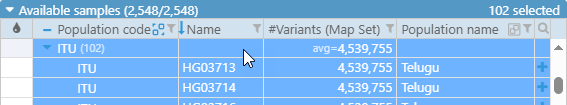
Finally, click the button in the grouped column's header to un-group the rows and return to the default view.
Reordering columns
Drag the column's header to move it to a new position in the table (this function is not available in all tables):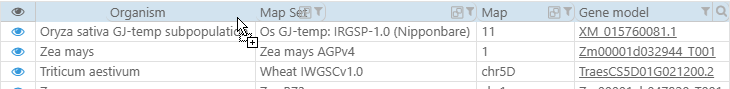
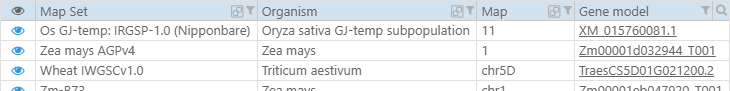
The new column ordering will be preserved when you copy the table's contents to the clipboard or Export the underlying data.
The context menu
Right-click anywhere in the table to bring up its context menu:
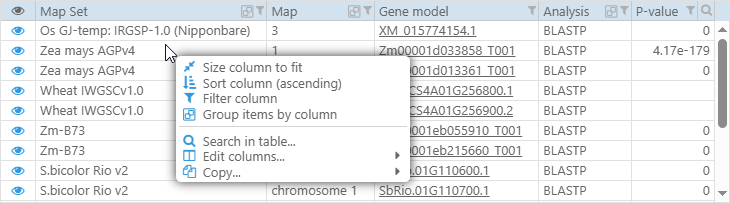
This menu contains all of the functions described above, plus some additional options. Most of the options in this menu affect a single column, which will be highlighted as you mouse over each menu item:
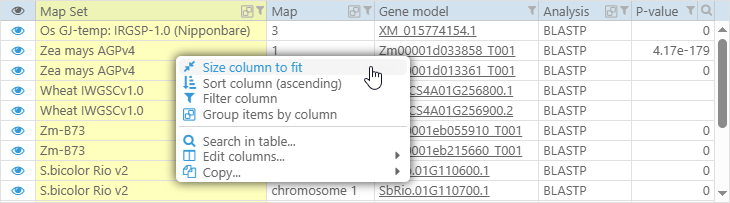
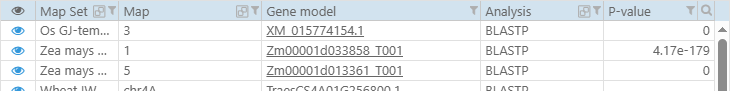
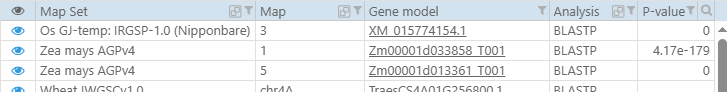
- Size column to fit: Attempts to resize the column so that its header as well as values are fully visible (possibly at the expense of shrinking the other columns in the table):
- Sort column: Sorts the table by this column (as described above). The text will change to indicate the new sort order: Ascending, Descending, or Clear sorting (thus returning to the default sort order).
- Filter column: Opens the column's filtering options (as described above).
- Group items by this column: Groups table rows by this column (as described above). This option may not be available for some columns (i.e. those that contain unique IDs for each row).
- Search in table: Opens the table's Quicksearch bar (as described above).
- Edit columns: Opens a pop-up list of all the columns available in the table; some of these may be hidden by default:
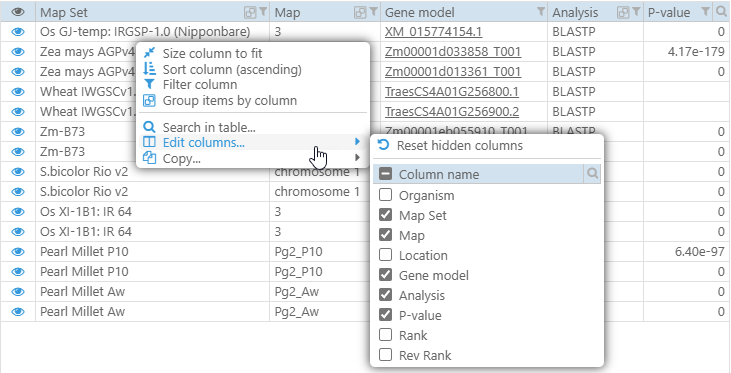
Click the column's name to toggle its checkbox; if the box is checked, then the column will be displayed in the table. For example, you can hide the Analysis and P-value columns, and show the Organism: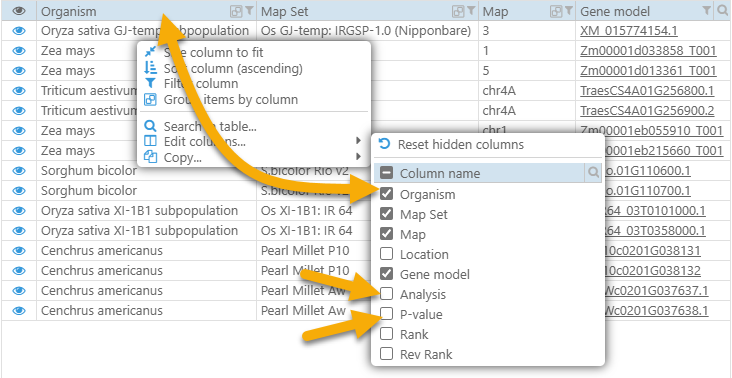
Select the Reset hidden columns option to return to the default view. You can also click the button to quickly search for a column by name:
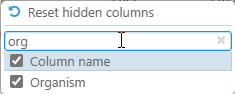
- Copy: Opens an additional menu, allowing you to copy the current cell value, row, column, or the entire table to the clipboard. The data that is about to be copied is highlighted in yellow:
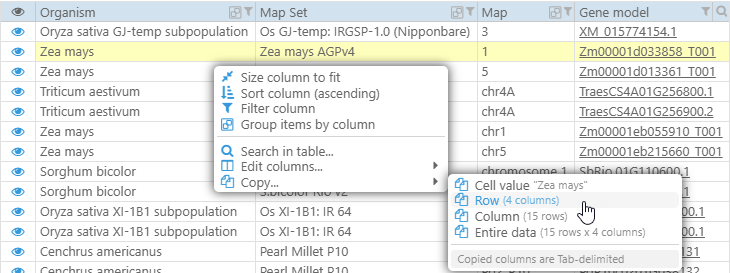
For convenience, each option also shows the size of the data to be copied. Copied columns are tab-delimited, making it easy to paste the copied data directly into Excel: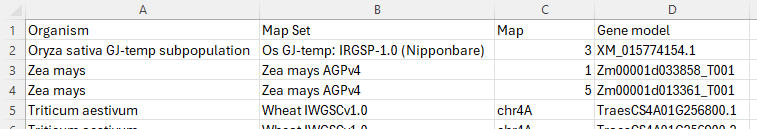
 Copyright © 2009-2025 by Persephone Software. All Rights Reserved.