Adding Quantitative Tracks
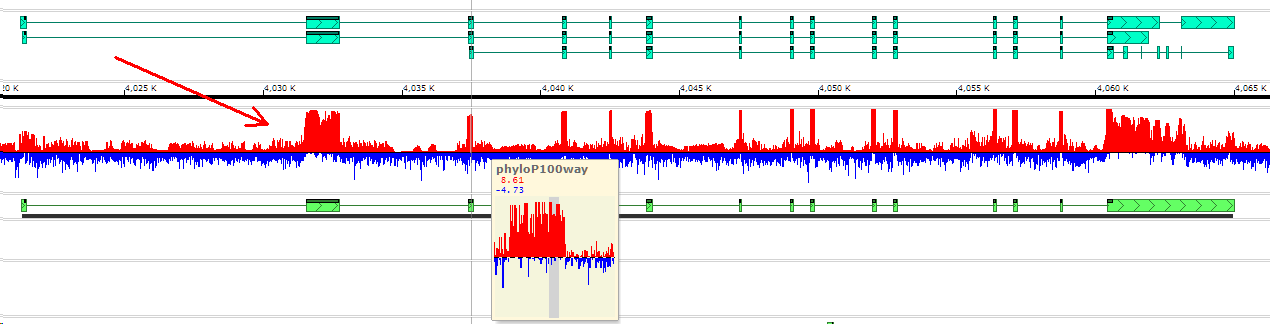
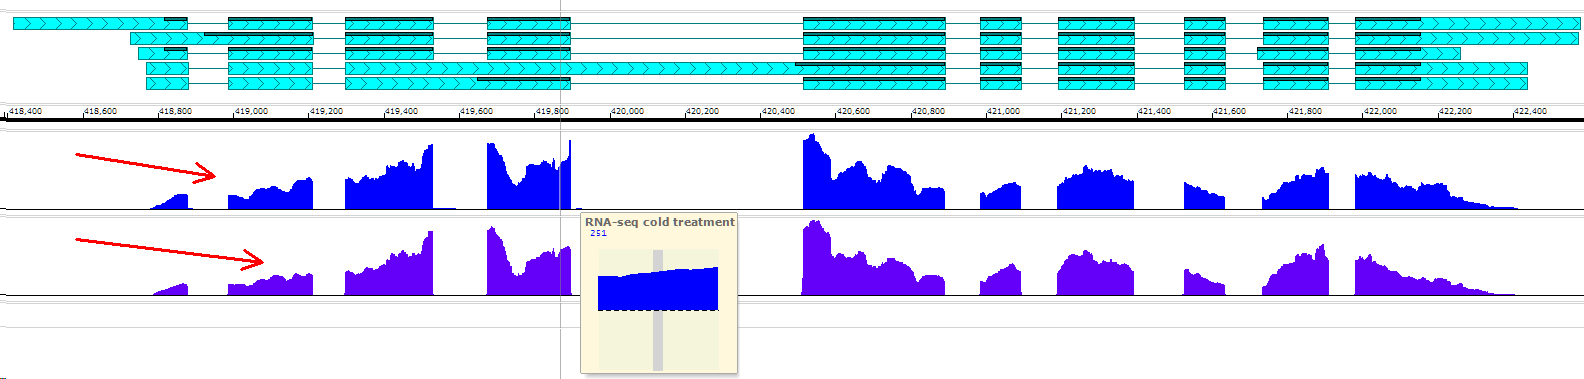
The data for a quantitative track like the ones above, can be loaded from bedgraph or bigWig or wiggle files. Typically, such tracks show RNA-seq coverage values, levels of DNA methylation, sequence conservation, etc.
A sample control file does not have anything complex and looks like this:
[ProcessRun]
; Run description: if specified, a custom description will be used,
; otherwise, "Added quantitative data for {MapSet Accession No.} from {Sources}." will be used.
RunDescription="Added methylation profile for GRCh37.p13 from TCGA."
[MapSet]
; Either MapSetId or MapSetPath is required.
; MapSetId: id of a target map set.
;MapSetId=232287170
; MapSetPath: path of a target map set.
MapSetPath="/Human/Human GRCh37.p13"
[Quantitative]
; Source (required): a local file on disk or remotely accessible via URL.
; the type of file is derived from its extension (before compression):
; .bedgraph and .bg => bedgraph
; .bedmethyl => bed9+2 with base modification probabilities
; other extensions => bigwig
Source="Samples/Quantitative/jhu-usc.edu_OV.HumanMethylation27.1.lvl-3.TCGA-09-0365-01A-02D-0359-05.hg19.bedGraph"
; TrackName: track name to be displayed on the plate.
TrackName="Methylation"
; TrackDescription: track description shared across maps in the MapSet.
TrackDescription="DNA Methylation profile loaded from jhu-usc.edu"
; ElementColor: {NamedColor|HTML hex code|R,G,B}.
; ElementColor is optional, if not provided, the default Blue color will be used for positive values.
; Note, the new colors will be effective only if both ElementColor and AlternateElementColor are provided.
ElementColor=Blue
; AlternateElementColor: {NamedColor|HTML hex code|R,G,B}. AlternateElementColor is optional, if not provided, the default Red color will be used for negative values.
; Note, the new colors will be effective only if both ElementColor and AlternateElementColor are provided.
AlternateElementColor=Red
; ParentGroupName: the new track will be placed under a parent node with this name.
; To reduce the number of track nodes on the top level, group the tracks of similar type.
ParentGroupName=methylation
; TrackQualifier: Add qualifiers that can help filtering the large track lists when using the Edit tracks interface in webPersephone
;TrackQualifier.Tissue=Liver
;TrackQualifier.Author=JHU
; IsShownFirst: if false, the track will not be shown by default when the map is opened for the first time
IsShownFirst=false
[MapMapping]
; If no mapping is found in this section, psh assumes that each MAP_NAME in file exactly matches a MAP_NAME in DB.
; If map names in file are different from those in DB, map each MAP_NAME in the file to a MAP_NAME in DB.
; The manual mapping is below:
;MAP_NAME_IN_FILE=MAP_NAME in DB
;Chr1=Chr.1
;Chr2=Chr.2
;Chr3=Chr.3
; Check 'printmapping' command that may help generating the name mapping tables.
; Alternatively, use MapIdentifiedBy
; MapsIdentifiedBy: if all maps in the file instead of the map name are identified by their alternative IDs like MAP_ID, ACCESSION_NO or GENOME_DNA_ID,
; provide the mapping with just one line using either MapName, MapId, AccessionNo or GenomeDnaId, for example:
; MapsIdentifiedBy: one of MapId, AccessionNo, GenomeDnaId, MapName (default)
;MapsIdentifiedBy=AccessionNo
; LoadListedMapsOnly: if true, only data for the maps listed in this section will be added.
; If false, PersephoneShell will still try to match names from the file to maps in the database
; using MAP_NAME, MAP_ID or ACCESSION_NO, and if the map is not found, the data line will be skipped
;LoadListedMapsOnly=true
;MAP_NAME_IN_FILE=MAP_NAME_IN_DB
[DbSequences]
; Specific to Oracle
; The ID columns below are used in loading quantitative data.
; If there is no sequence/trigger assigned to these columns, you must specify a sequence for them.
;TABLE_NAME.COLUMN_NAME=SEQUENCE_NAME
;PROCESS_RUN.RUN_ID=ID_SEQ
;QUANT_RUN.QUANT_RUN_ID=ID_SEQ
;DESCRIPTION.DESCR_ID=ID_SEQ
;TRACK.TRACK_ID=ID_SEQ
;TRACK_STYLE.TRACK_STYLE_ID=ID_SEQ
;QUANT_RUN_PAIR.QUANT_PAIR_ID=ID_SEQ
;QUANT_RUN_QUALIFIER.QUALIFIER_ID=ID_SEQ
;QUANT_TILE.QUANT_TILE_ID=ID_SEQ
The only new things here are ElementColor (positive values) and AlternateElementColor (negative values). Note, the new colors will be effective only if both ElementColor and AlternateElementColor are provided.
The rest of the instructions follow the patterns of other INI files: the track should reference an existing map set; map names from the file can be remapped to the values from the database; etc.
In Persephone, the values in the quantitative tracks will be dynamically scaled based on either the maximum value in an entire track or in the visible portion of the track. Please check Tools/Settings/General display interface of Persephone main application:
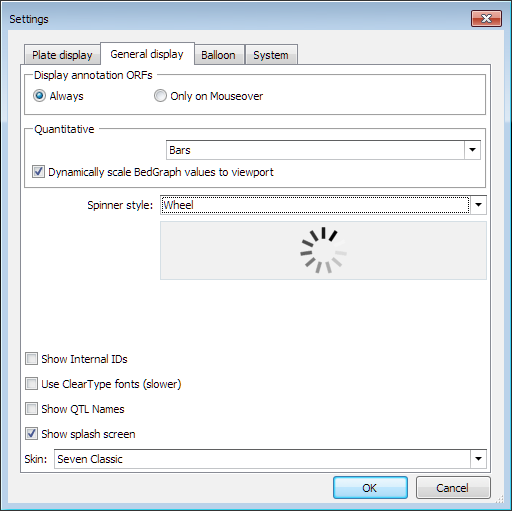
The default value for this check box is controlled via Persephone.exe.config record:
<setting name="DynamicallyScaleBedGraphValues" serializeAs="String">
<value>True</value>
</setting>
The command line
The command for adding the quantitative track is:
add quantitative -c <path to control file>
As usual, first, run it in the test mode using -t switch, then, if the tests are successful, load the data with the verbose output (-v).
 Copyright © 2009-2024 by Persephone Software. All Rights Reserved.