Bed files
The files in BED format can provide additional annotation for the sequence maps.
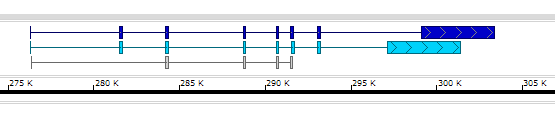
Here is an example of the BED file with all 12 columns:
browser position chr1:253742-303353
browser hide all
track name="ItemRGBDemo" description="Item RGB demonstration" visibility=2 itemRgb="On"
chr1 253742 255091 teal_gene 0 + 253742 253742 250,200,100 2 104,155, 0,1194,
chr1 276321 303353 dblue_gene 0 + 284187 299335 0,0,200 8 73,203,148,137,129,156,184,4257, 0,5160,7845,12411,14326,15177,16713,22775,
chr1 276323 291537 cyan_gene 0 + 276323 276323 0,210,250 8 73,203,148,137,129,156,184,4257, 0,5160,7845,12411,14326,15177,16713,20775,
chr1 276352 291629 nothing 0 + 284187 291629 0 5 42,148,137,129,131, 0,7814,12380,14295,15146,
A minimum set of columns is: map_name, feature_start, feature_end
1 1000000 9990000
1 10000000 19990000
2 1001 2000
1 2000 3000
Colors
Note that the bed files allow creating annotation tracks with features that have individual colors (the eighth column).
chr1 253742 255091 teal_gene 0 + 253742 253742 250,200,100
chr1 276321 303353 dblue_gene 0 + 284187 299335 0,0,200
chr1 276323 291537 cyan_gene 0 + 276323 276323 0,210,250
chr1 276352 291629 nothing 0 + 284187 291629 0
Unlike the marker tracks created in a similar way from the .csv files and also providing coloring capabilities, the bed file records can define multi-exon genes.
thickStart and thickEnd
In case when the bed file is added as an external file, the CDS information ("thickStart" and "thickEnd") is ignored - just to avoid misinterpreting internal regions (e.g., providing protein sequences) which could mean something completely different from the CDS.
chr1 253742 255091 teal_gene 0 + 253742 253742 250,200,100
chr1 276321 303353 dblue_gene 0 + 284187 299335 0,0,200
chr1 276323 291537 cyan_gene 0 + 276323 276323 0,210,250
chr1 276352 291629 nothing 0 + 284187 291629 0
 Copyright © 2009-2024 by Persephone Software. All Rights Reserved.