Web Persephone: The GC-Content track
The GC-Content track displays the GC content of genomic sequences on physical maps; when zoomed in, it displays the individual nucleotides of the sequence. By default, the track is placed at the very top of the map (although you can move it by dragging its label in the Track Panel):
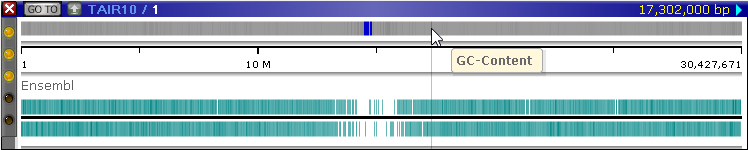
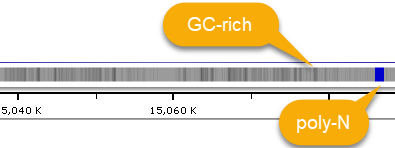
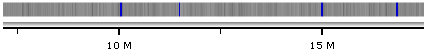
When zoomed out, the track shows a heat map of the GC-content of the map's sequence; dark gray areas represent GC-rich regions, and blue bands represent poly-N regions (as usual, you can change the color scheme of the track by right-clicking it and selecting "Configure track options" from the pop-up menu). Zooming in reveals more fine-grained detail:
Zooming in even further reveals individual nucleotides, highlighted according to their base-pair values:

You can also expand the track from the Track Panel, or by right-clicking on the track and selecting Expand track from the popup menu. When expanded, the track will also display the nucleotides on the other strand, as well as the 3-frame translation for both strands:
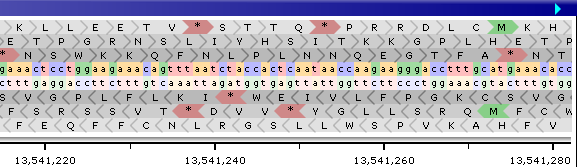
Start codons are highlighted in green; stop codons, in red.
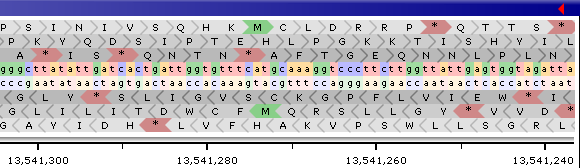
Normally, the top half of the GC-content track displays the sequence of the direct strand, and the bottom half the reverse-complement sequence of the opposite strand. However, if the map is inverted, then order of these lines will be switched, with the opposite strand shown on top:
You may wish to hide this translation (in order to save some space on the screen). To do so, right-click the track to bring up its context menu, then uncheck the Show translation checkbox: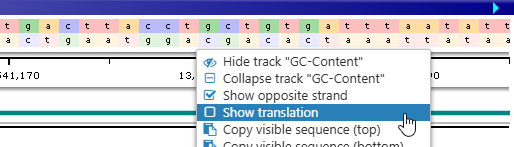
You can also uncheck the Show opposite strand checkbox to hide the reverse-complemented sequence as well as translation for the opposite strand: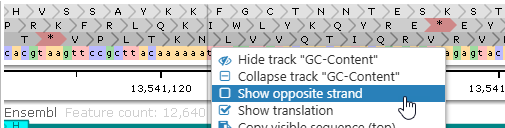
Exporting the genomic sequence
In addition to the standard choices available for all tracks, this track's context menu enables a quick way to copy the genomic sequence to clipboard:
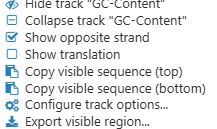
Both of the "Copy visible sequence" menu items only become available when the map is zoomed in. Click Copy visible sequence (top) to copy the top line of the currently displayed sequence to the clipboard, in FASTA format:
>1:13541216..13541258
aaactcctggaagaaacagtttaatctaccactcaataaccaa
Select Copy visible sequence (bottom) to copy the sequence on the other strand. Select Export visible region to open the Export Sequence dialog for this map, where you can fine-tune your export parameters.
Changing the DNA highlighting mode
You can change the highlighting mode for individual nucleotides on the GC-Content track in the Settings menu. To do so, select Tools | Settings from the main toolbar, then open the Tracks | Sequence tab in the Settings dialog:

- 4-Colors: This is the default highlighting scheme, where each kind of base pair is highlighted with its own color: a, c, g, t (as shown above).
- GC: In this mode, "g" and "c" are shown in black; "a" and "t" in gray; and "n" in blue:

- None: In this mode, all nucleotides are shown in black-and-white.
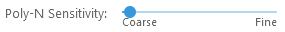
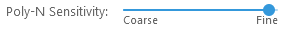
You can also adjust the "Poly-N Sensitivity" slider to emphasize (or de-emphasize) regions with high poly-N content when the map is zoomed out. The "coarse" setting will hide shorter poly-N regions, whereas the "fine" setting will reveal them:

 Copyright © 2009-2025 by Persephone Software. All Rights Reserved.