Markers and QTLs on Physical and Genetic Maps
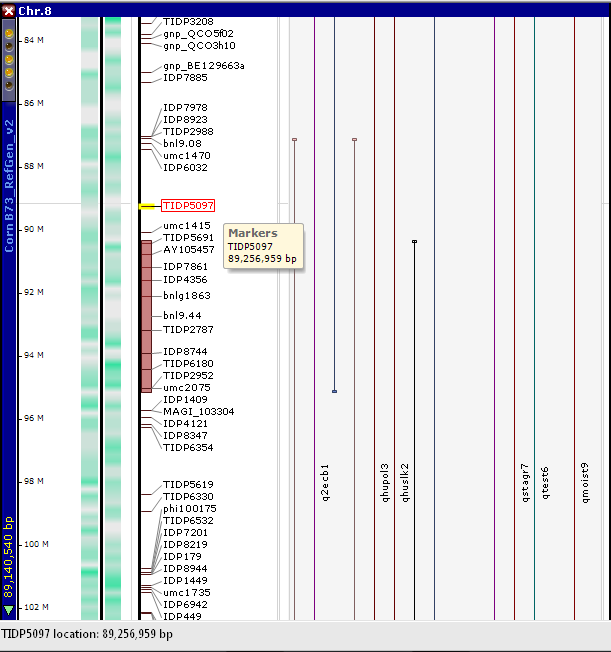
Two other common data tracks on physical and genetic maps are the marker and QTL data tracks. In a physical or genetic map, the marker data track displays the marker names in horizontal orientation with tick marks connecting the location (in bp) on the physical map. You may need to zoom in to see individual markers if the density of markers is very high (figure below). If you place your mouse pointer over the marker name a tool tip with the data track name, marker name, and marker location will be displayed.
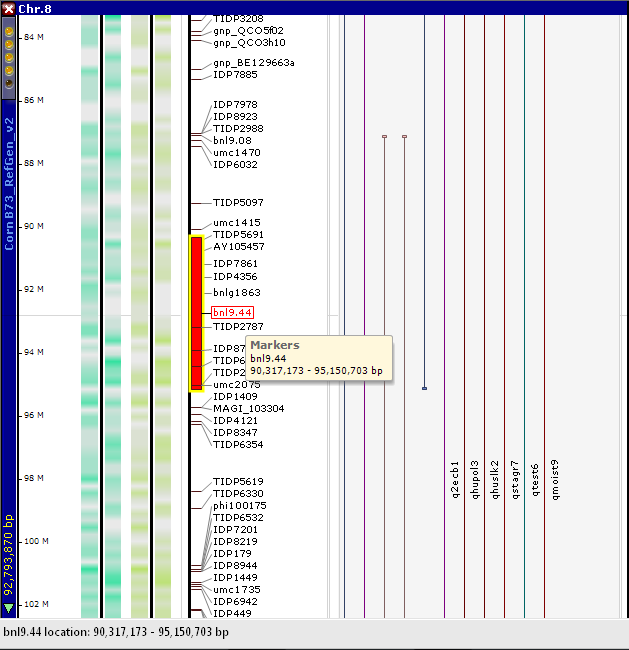
If you click on the marker name the Marker Details window will be displayed (not shown here). This window is essentially identical for markers on physical or genetic maps. Some markers that span particularly large distances will have a colored vertical bar showing the size of the marker along the vertical line of the data track (e.g., marker bnl9.44 as shown in the figure below). The tool tip for the marker will give two values rather than one in order to delimit the span of the region (in bp for physical maps and in cM for genetic maps) rather than a single location.
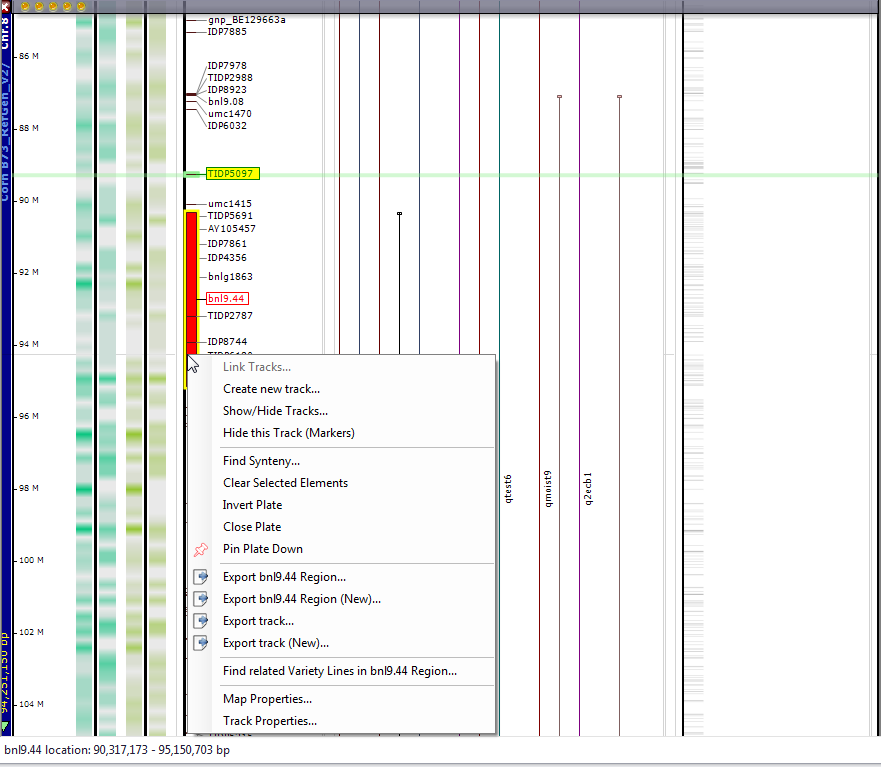
If you right click on the marker name, a Create new track menu selection appears in the right-click menu (see the figure below). For markers spanning large regions, the right-click menu will have a menu selections Export Region and Export Region (New), which display Export Track and Export Track (New) windows, respectively, limited to just the region defined by the marker. For markers with a single location (not a range), this option will appear in the right-click menu but will be grayed out and unavailable for use.
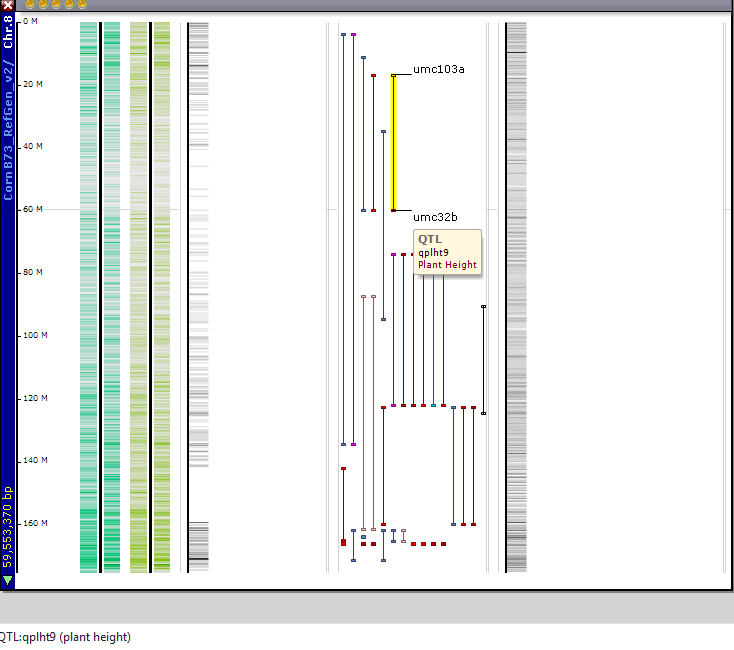
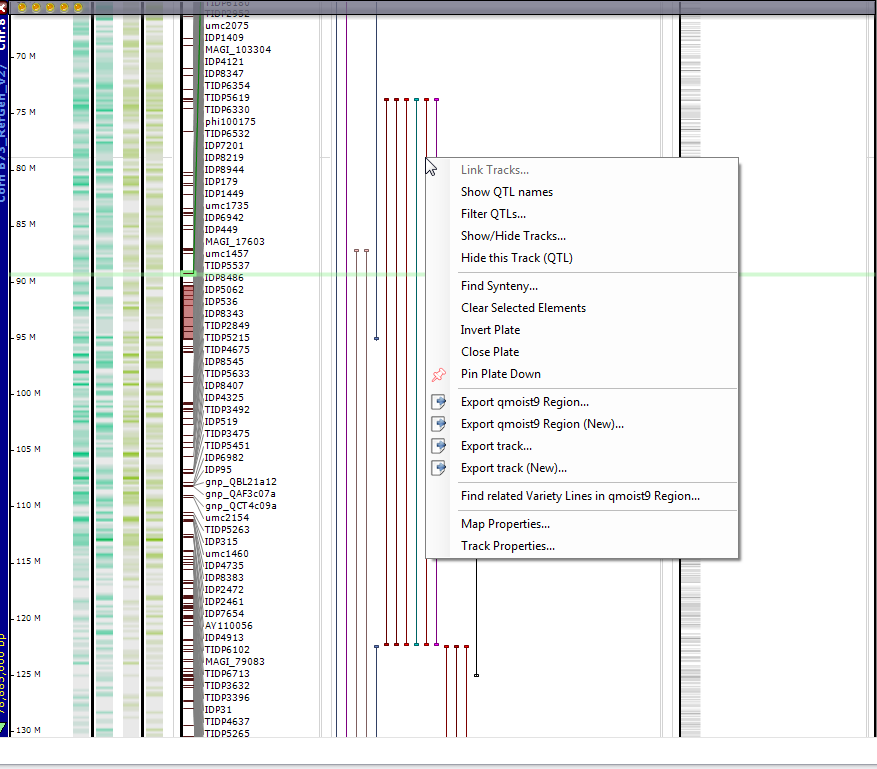
In a physical or genetic map, the QTL data track displays QTLs as vertical lines in vertical orientation (see the figure below). If you hold the mouse pointer over a QTL, it is highlighted in yellow and a tool tip appears with the QTL name and trait. In addition, at the ends of the QTL the left marker and right marker names will be displayed in horizontal orientation (if present). If you click on a QTL, the QTL Details window is displayed (see QTL Details).
If you right click on the QTL, a right-click menu is displayed (see the figure below). It is similar to the right-click menu for genes in the CDS data tracks but has two additional menu selections: Hide QTL names and Filter QTLs. The Hide QTL names selection will hide all of the QTL names although the left and right marker names will still be displayed. If you select Filter QTLs the QTL Filter window will be displayed, which will enable you to control which QTLs will be displayed.
The markers and QTLs data tracks in genetic maps have identical behaviors to physical maps. Distance is measured in cM in genetic maps and in bp in physical maps but otherwise the same windows and menus are displayed for left and right mouse clicks.
 Copyright © 2009-2024 by Persephone Software. All Rights Reserved.