Gene and Gene Data Track Information
Placing the mouse arrow over a gene feature on a data track highlights the gene and displays a thumbnail gene map providing a brief summary of the feature including the data track name, a systematic name, and a small map of the feature (left figure below). In order for the miniature graphic to be displayed the checkbox for Show Annotation Preview (Tools>Settings>Balloon) must be checked (see Settings).
Track Right-Click Menu
If you right click on a data track, the right-click menu is displayed:
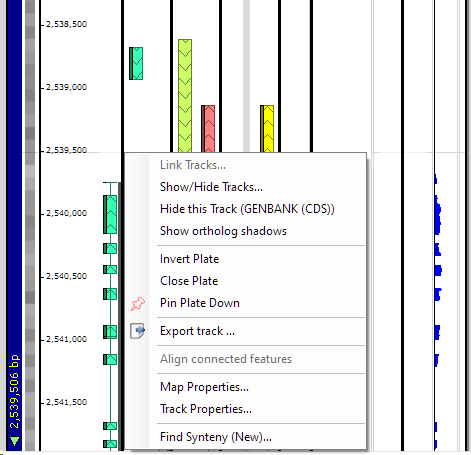
The options in this menu are described below.
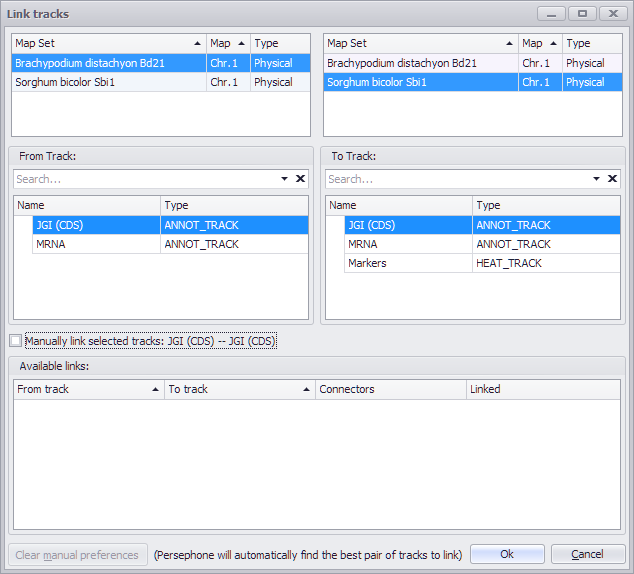
Link Tracks
Select this option to link tracks on different plates. You may need this if the pair of maps can be linked via different tracks. For example, annotation tracks with genes can be linked using ortholog pairs, while the marker tracks are connected by common markers.
A form like the one below will appear. It has three groups of panels. The top one lists the maps shown on screen. The tracks in the selected maps are shown in the middle section. By default, Persephone tries to link the gene tracks first. If you want to use other tracks, select them from the lists and check the check box saying "Manually link selected tracks".
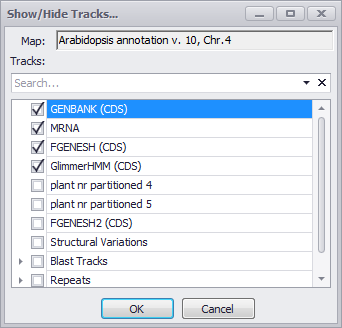
Show/Hide Tracks
Provides a checkbox menu for selecting the data tracks to be displayed.
Hide this Track
Indicates the track currently selected and enables you to hide it.
Find Synteny
Provides a listing of species and their respective chromosomes with syntenic relationships. Please see Comparing Maps for more information.
Invert Plate
This will reverse the orientation of the entire plate and all tracks, so that the first nucleotide is now displayed at the bottom of the plate rather than the top.
Close Plate
Closes the entire plate.
Pin Plate Down
Pins the plate down.
Export Gene Region
See Export Track Window for more information.
Export Gene Region (New)
See Export Track Window for more information.
Export track
See Export Track Window for more information.
Export track (New)
See Export Track Window for more information.
Map Properties
This selection opens a window to display information about all data tracks available on the plate whether they are displayed or not (see the figure below). The Map Set Details button at the top right of the window will open up another window showing various details about the Map itself, such as the source of the data.
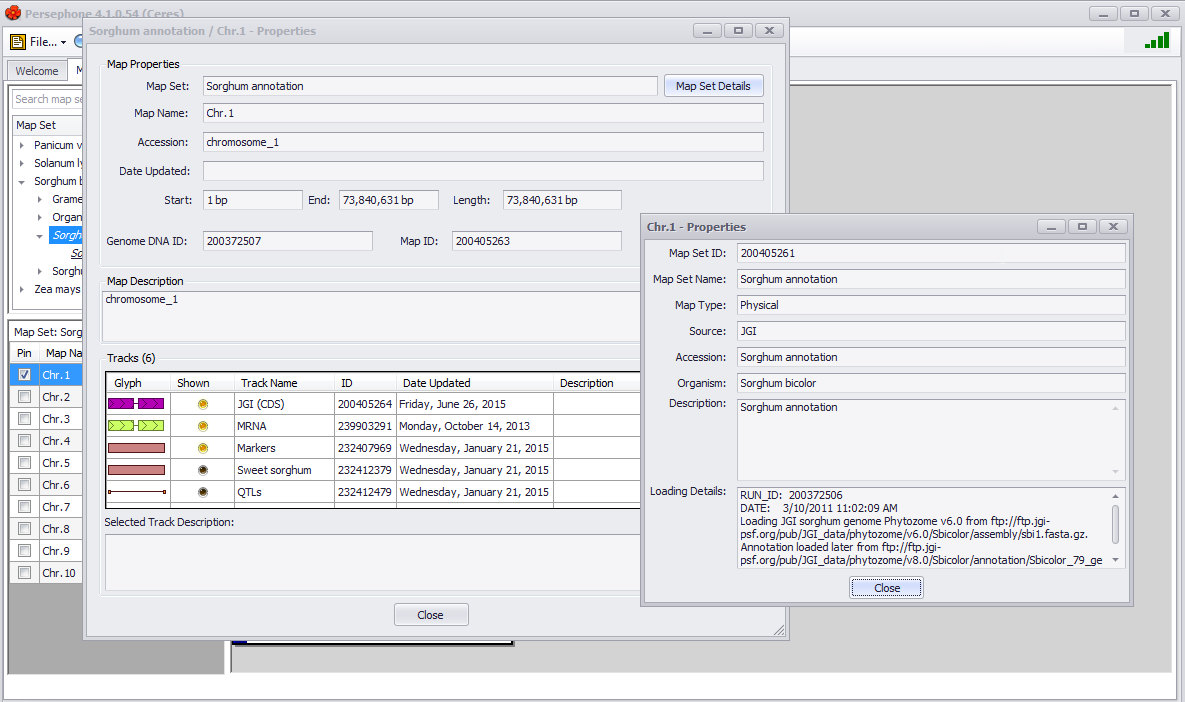
Track Properties
Similar to Map properties but for the specific track selected when the right-click menu was selected is highlighted in the Tracks panel.
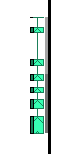
Vertical Track Display Information
|
|
There are several additional features in the vertical track display. If there are multiple splice isoforms for a gene, Persephone will show only one of the forms and the rest of the models will leave a "shadow" near the axis line. The density of the shadow corresponds to the number of hidden gene models. Here, in the picture on the left, there are three more models that are not shown, and the shadow's density helps us to see where the majority of the isoforms land. A tooltip window will be shown when the mouse moves over a gene model. The popup window will show all available isoforms. Tip You can select how many models to show in Settings > Balloon > Maximum Annotations. See Settings for more information.
|
The annotation information available for a gene (physical maps only) can be displayed by clicking on a gene feature as shown below. The selected gene, shown below, will be highlighted when you click on it.

 Copyright © 2009-2024 by Persephone Software. All Rights Reserved.