Web Persephone: The Quantitative track
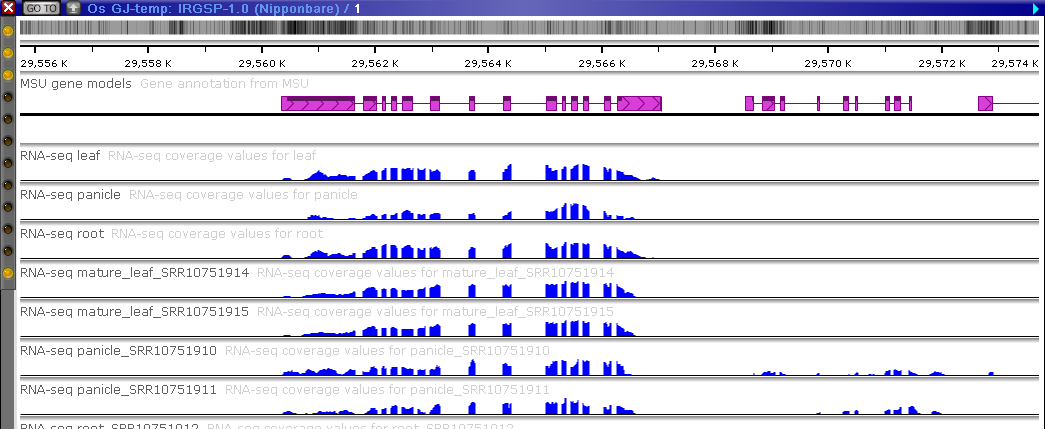
The Quantitative track displays numeric values across the entire map as a graph; for example, it can be used to display RNA-seq output or differential expression. Quantitative tracks are typically loaded from BedGraph or Wiggle files. By default, and in collapsed mode, quantitative tracks display their values as solid bars:
You can resize a quantitative track by positioning the mouse on the solid line underneath the track so that the mouse cursor changes to the sizing icon; then, drag the mouse to resize the track:


Resizing the track also reveals the Y-axis scale on the right-hand side:
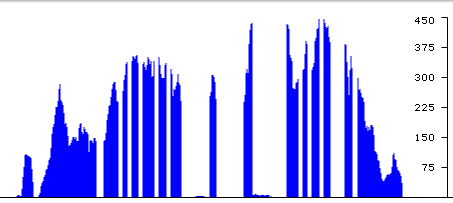
The tooltip balloon for the track shows a zoomed-in view of the portion around the mouse, and the current numeric value directly under the hairline cursor:

Display modes and scaling
You can change the display mode of the track from solid bars to a single line. To do so, right-click the track, choose Display mode from the context menu, then select XY plot:


You can also use the context menu to change the scaling mode of the track. By default, values are scaled linearly, but you can instead select the square root or logarithmic scales:


Normalization
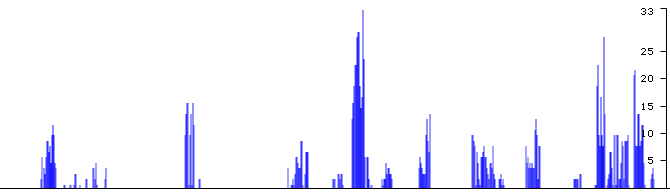
By default, quantitative track values are normalized to the viewport, i.e. the portion of the track visible on screen. For example, if you scroll the map to slide the tall peak out of view, the smaller peaks will expand to fill the entire available space on the track:

Note
The scale on the right-hand side will automatically adjust to display the minimum/maximum values that are currently visible.
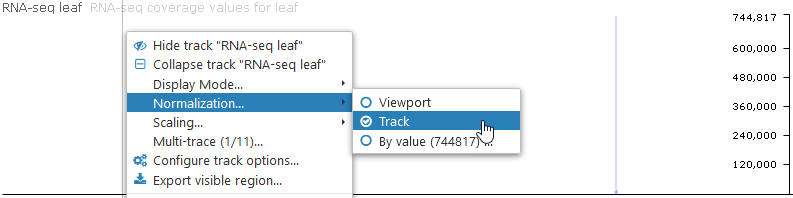
To change this behavior, right-click the track, select Normalization, and choose a new normalization mode. Select Track to normalize the values across the entire track, regardless of zoom level:
In linear scaling mode, doing so could cause all but the largest peaks to disappear (as in the example above), though you can always switch to e.g. log scaling:

You can also change the normalization mode to a specific value. For example, this can be useful when comparing expression values across multiple tracks, such as expression values in different tissues. If the normalization mode is set to Track, peaks on different tracks may appear to be the same height. However, setting the normalization to 800,000 for all the tracks will reveal the relative height of each peak:


Note
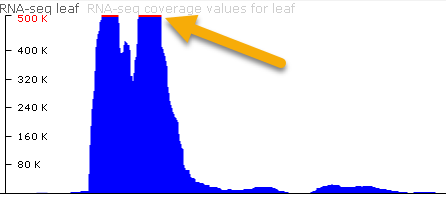
The color of the maximum value on the track's scale will change to red when the normalization mode is set to a specific value.
If the provided maximum value is lower than the actual height of the peak, then the peak will be clipped, as indicated by the red line above it:
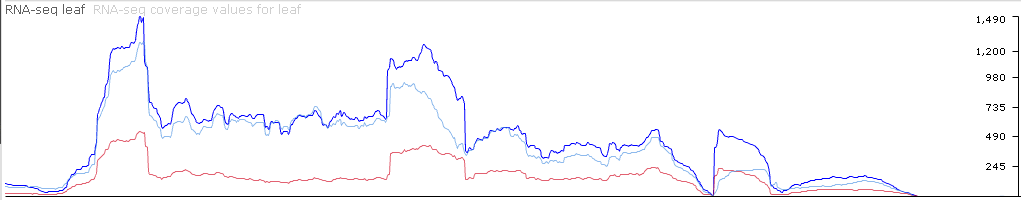
Multi-Trace
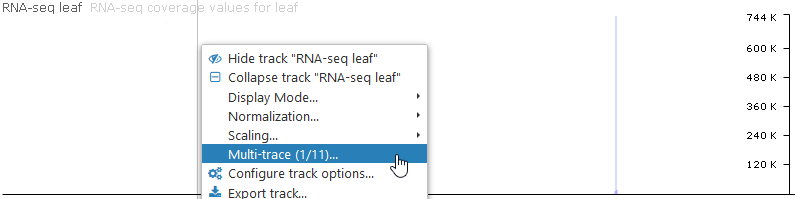
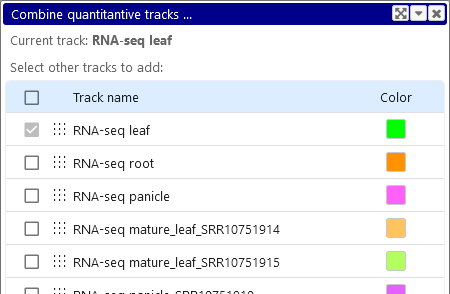
You can combine multiple quantitative tracks into a single plot, e.g. to overlay expression values in various tissues for comparison (or just to save some space on the screen). To do so, right-click the track, then select Multi-trace from the context menu to open the Multi-trace dialog:
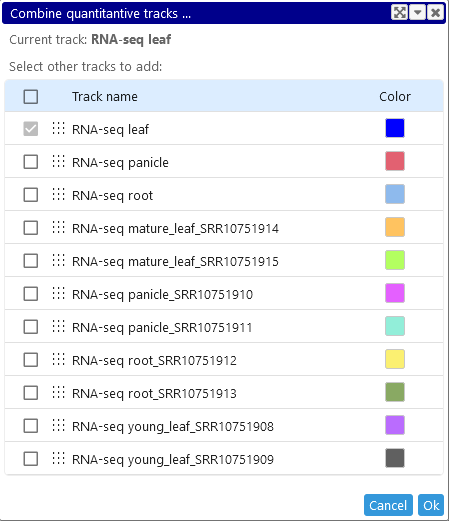
In this dialog, the current track is shown at the top, and is always selected. Check the checkboxes next to other tracks to add them to the multi-trace plot, then click the Ok button:
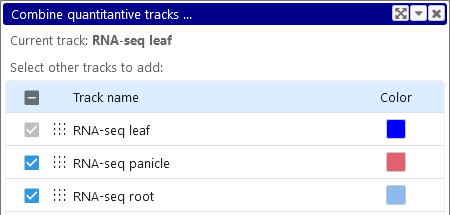

You can also change the order of tracks in the Multi-trace dialog by dragging them. The track that is topmost in the dialog will be drawn "in the back" of the plot; the track second from the top will overlay it; the track third from the top will overlay them both; and so on. For example, you could drag the RNA-seq panicle track beneath the RNA-seq root track to make it easier to see:


Switching to the XY plot display mode (as described above) could also make the separate plots easier to distinguish:
You can also change the colors of the individual sub-plots by clicking their color swatches in the Multi-trace dialog:


Finally, to exit Multi-trace mode, uncheck all of the checkboxes in the Multi-trace dialog. You can do so quickly by clicking the tri-state checkbox in the header twice (the first time to select all remaining tracks, and the second time to select none):


As always, click the Ok button to confirm your selection and return to normal track view.
 Copyright © 2009-2025 by Persephone Software. All Rights Reserved.