Web Persephone: The Real-time BLAST track
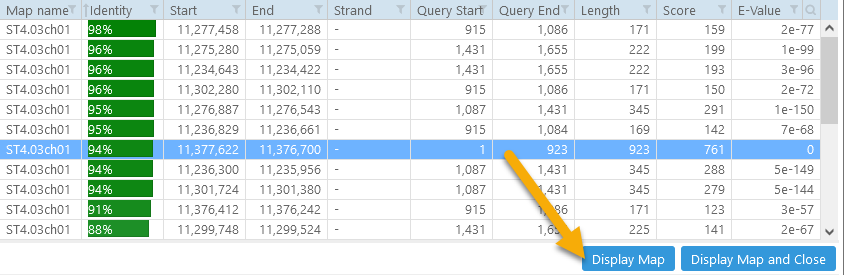
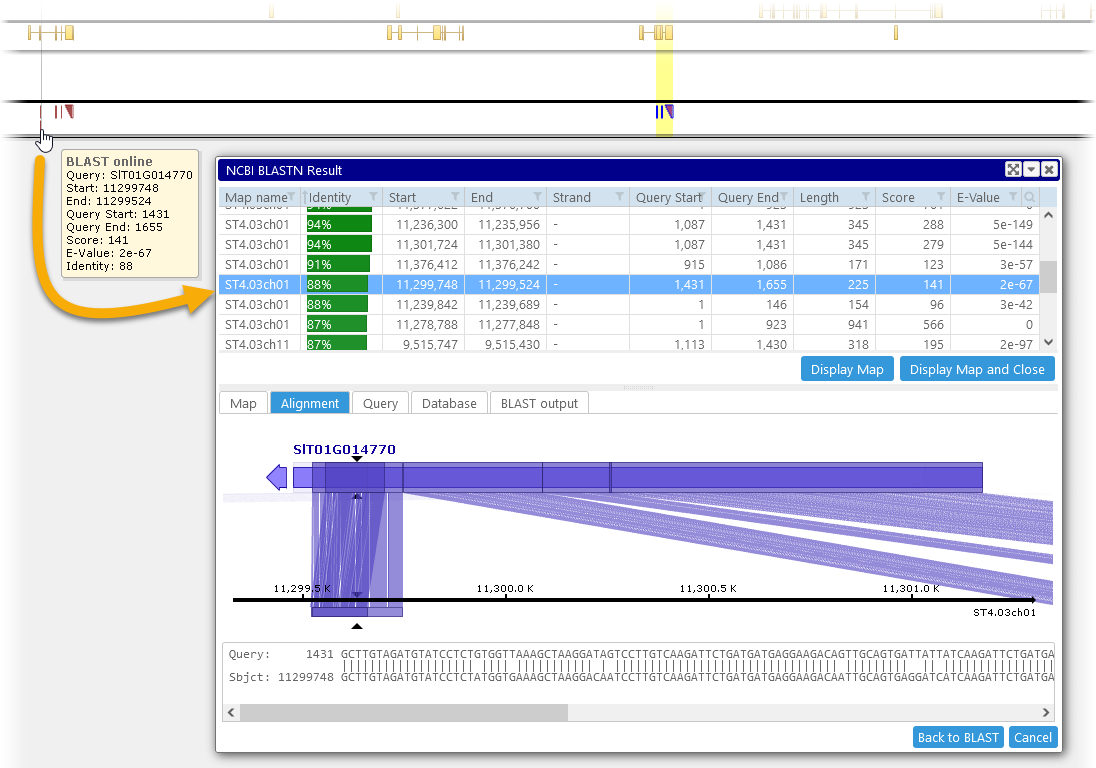
This track displays HSPs (High-Scoring Pairs) produced by running BLAST via the Run BLAST dialog. To create this track, select one of the HSPs in the summary table at the top, and click Display Map (or Display Map and Close):
The selected map will open in the main view (if it wasn't open already), and will zoom in to the selected HSP; in addition, if the HSP is part of a chain, the region spanning the entire chain will be highlighted:
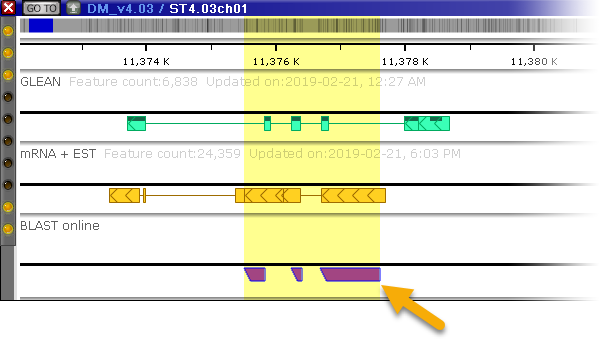
This HSP happens to be located on the reverse strand, as is indicated by the leftward-pointing slant of its element on the track, and its dark purple color (as well as its position below the axis). HSPs on the direct strand are drawn in cooler colors, such as green or blue, and are positioned above the axis:
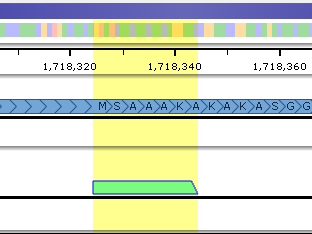
Mouse over an HSP to view its properties in a tooltip balloon; note that all HSPs in its chain will be highlighted:
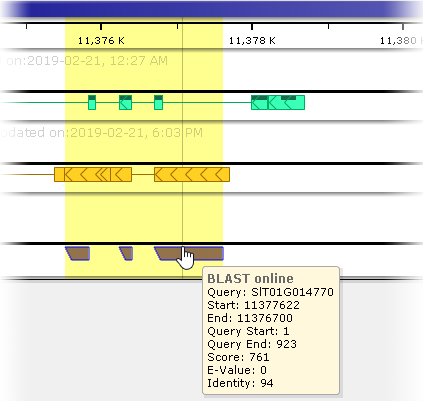
As always, you can zoom out the map to see the other hits (if any). Click any HSP to re-open the Blast Results dialog, and select that HSP in the summary table:
 Copyright © 2009-2024 by Persephone Software. All Rights Reserved.