Web Persephone: The BAM track
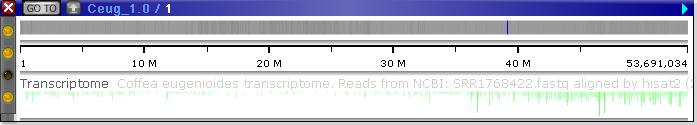
The BAM track displays multiple reads aligned to a reference genome. In collapsed mode, the track only shows the distribution of reads as a histogram:
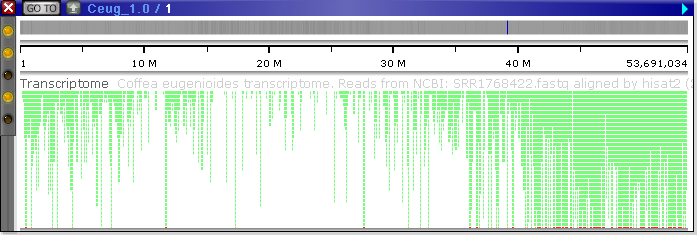
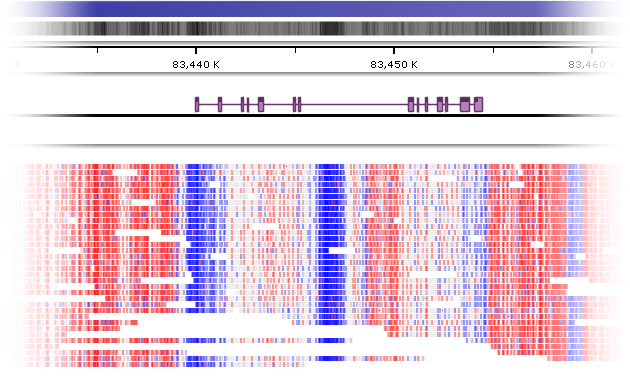
Expand the track to show the pile-up of reads in more detail. The track will automatically adjust its height (similarly to the Annotation track):
Note
This high-resolution preview is not available for BAM files that were imported into private user storage from an external URL (or imported into the current browser session instead of long-term private storage).
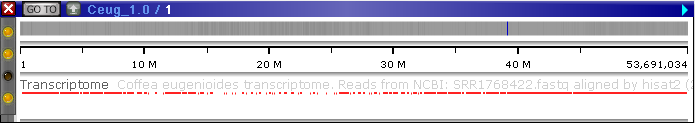
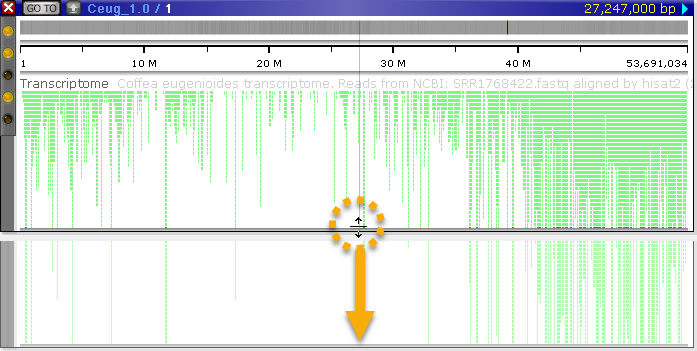
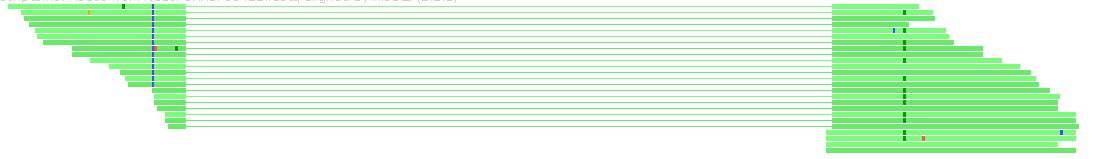
The red lines at the bottom of the track indicate that some of the reads extend beyond its edge. You can manually adjust the track's height by dragging its bottom edge with the mouse:
You can also increase or reduce the thickness of the reads by choosing the appropriate option from the track's right-click context menu, or by holding down the Alt key and rolling the mouse wheel:
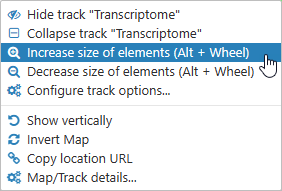
Note
The Alt + Mouse wheel shortcut may not work properly in Firefox.
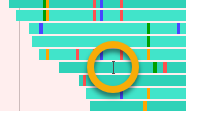
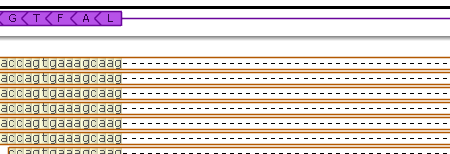
Zoom in to view individual read alignments in more detail:
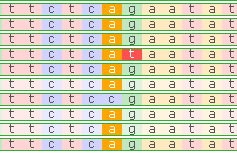
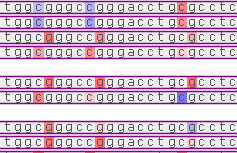
Reads on the direct strand (+) are shown in a lighter color, while reads on the reverse strand (-) are darker; gaps in read alignment are rendered as thin lines (similarly to introns on the Annotation track). By default, mutations (such as SNPs or insertions) are highlighted according to the nucleotide that differs from the reference; although you can change this in the BAM track's options (discussed in more detail below).
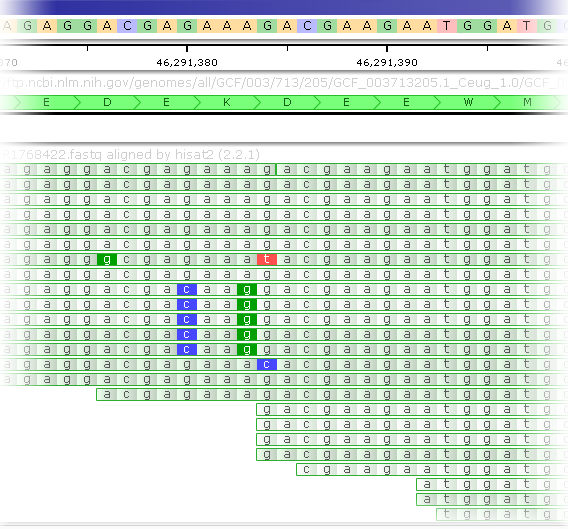
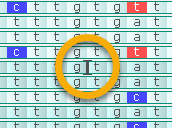
Zoom in further to see individual nucleotides for each read; you may find it useful to also enable the GC-content track and any Annotation tracks on the same map:
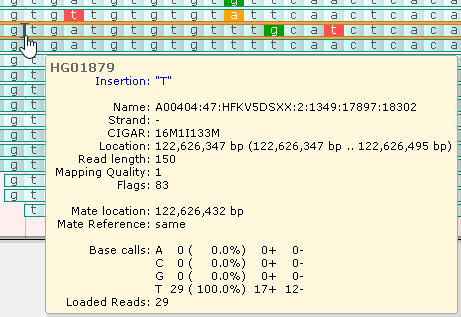
Mouse over a read to display a pop-up balloon containing additional information about the read:
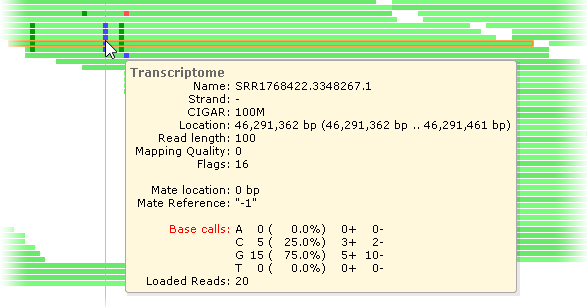
The current read is outlined with a yellow border. The popup balloon shows the name of the read; its CIGAR string; and additional information about its mapped location on the reference. The table of base calls (at the bottom of the balloon) lists the counts and percentages of reads with mismatches at the current location (i.e., the nucleotide currently under the mouse cursor). In this example, 5/20 reads have a "C" at the current location, and 15/20 reads have a "G". The table header is highlighted in red since not all reads agree on the nucleotide (indicating a potential variant call). The two rightmost columns display the counts of reads per strand.
If the current read has a mate pair, its location will likewise be shown in the popup balloon; if the paired read is visible on the screen, it will be outlined with a dark red border:
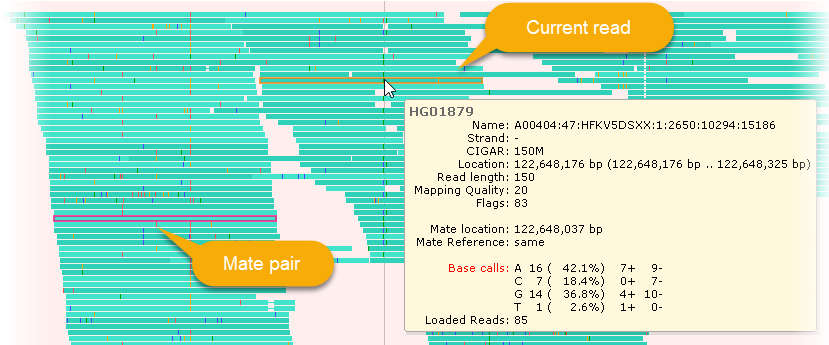
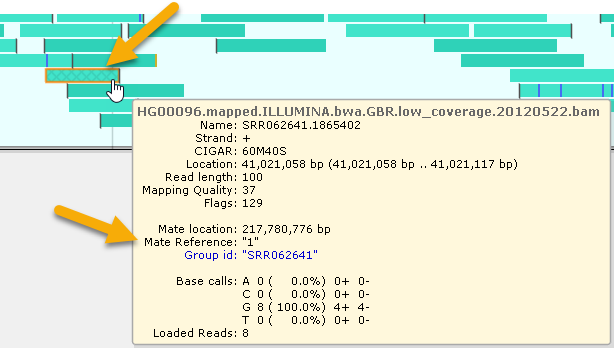
Reads whose pairs are located on another chromosome are displayed with a cross-hatched pattern, as shown above.
Insertions are marked with a special symbol placed between the affected nucleotides when the track is zoomed in. You can mouse over the insertion symbol to view the inserted sequence:
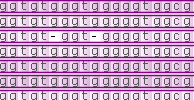
Deletions and padding (e.g. for intron-spanning reads) are indicated by dashes:
Soft-clipping sites are marked with square brackets; mouse over them to view the soft-clipped sequence fragment of the read:
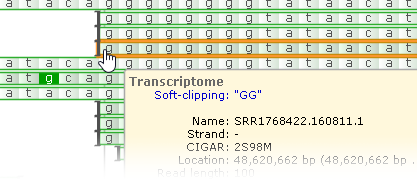
You can also click the read to open the BAM Read Details dialog, where you can view detailed information about the read and its sequence.
Methylation color coding
Some BAM files contain additional data (in MM/ML fields) indicating the level of DNA methylation (5mC) of CpG islands. By default, the nucleotides of such BAM reads are color-coded by methylation probability (blue if the probability is high, and red if it is low):
You can turn this color coding on or off in track view options, as described below. You can also preview the MM/ML fields in the read's tooltip, or click the read to view them in more detail.
BAM track view options
To change the way aligned reads are displayed, right-click anywhere on the BAM track and select View options from the context menu. Note that this menu is not available at low zoom level, when individual reads are not shown.
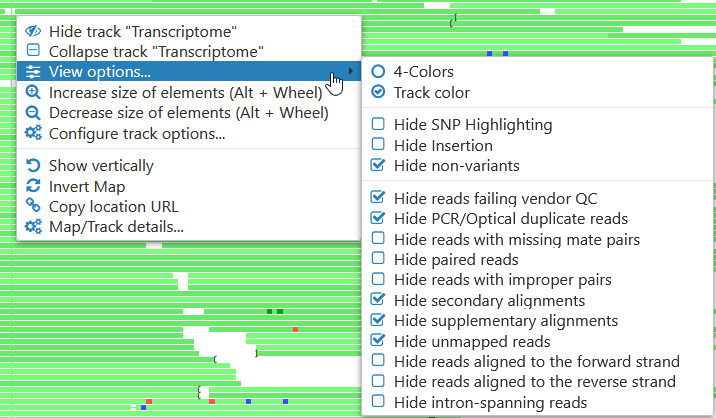
- 4-Colors / Track color / Base Modification (5mC): Toggles coloring options of individual nucleotides on aligned reads. By default, the bases that match the reference sequence are colored according to the foreground color of the BAM track; choose 4-Colors to instead color each nucleotide according to its value. If methylation data is present in the BAM file, you can also select Base Modification (5mC) to color the nucleotides by their methylation probability:
Nucleotides that are different from reference are highlighted in a bolder color; however, you can change this using the next option: - Hide SNP Highlighting: Removes highlighting for nucleotides that are different from reference.
- Hide Insertion: Hides the insertion symbols. When using the Base Modification mode, the insertion symbols are automatically hidden as typically, PacBio long reads used to produce the modbam files have high level of errors, and the large number of insertions would obscure the picture.
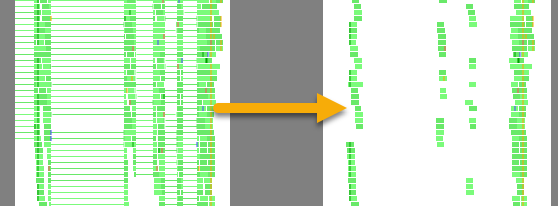
- Hide non-variants: Hides nucleotide letters that are identical to reference even when the track is zoomed in; doing so can make variants easier to notice. In addition, soft clipping sites are annotated with the count of soft-clipped nucleotides (in CIGAR format):
- Hide paired reads: Hides reads that have mate pairs.
- Hide reads aligned to the forward/reverse strand: Hides reads aligned to the specified strand.
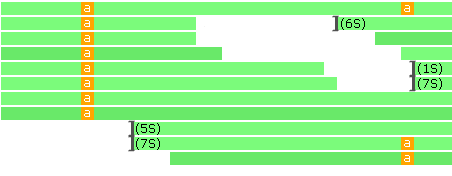
- Hide intron-spanning reads: Hides reads with gaps in their alignment:
The rest of the options hide reads marked with specific flags in the BAM file; refer to the BAM format specification for more information.
 Copyright © 2009-2024 by Persephone Software. All Rights Reserved.