Web Persephone: The Annotation track
The Annotation Track displays genomic annotations: typically transcripts or gene isoforms. In collapsed mode, the track displays two heatmaps of annotation density, one for each strand:
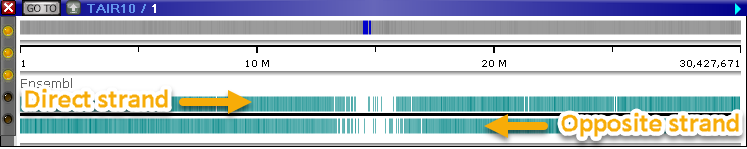
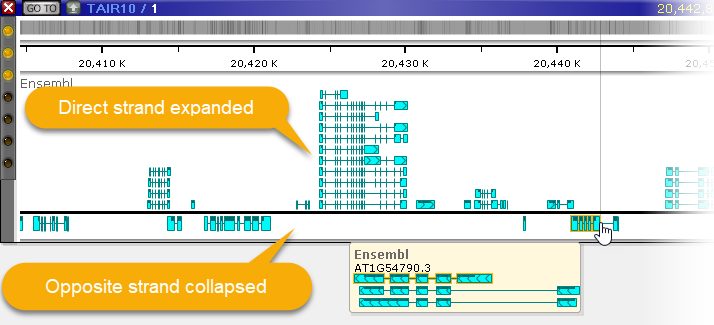
The top line represents the Direct strand, and the bottom line represents the Opposite strand. Expand the track (e.g. via the Track Panel) to show the "pile-up" of transcripts:
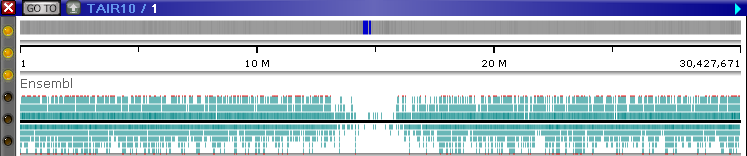
The red lines at the top and the bottom of the track indicate that some of the transcripts extend beyond its edges. After a few seconds, the track automatically expands to full height:
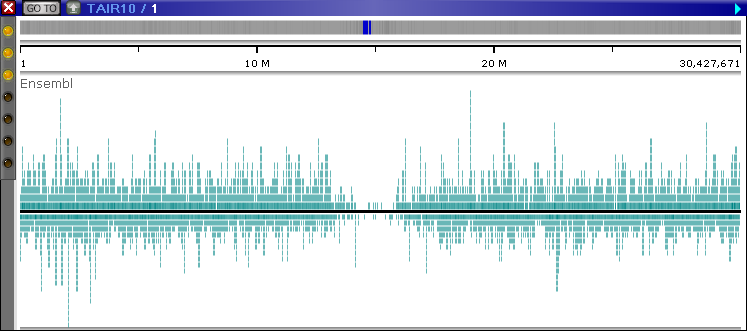
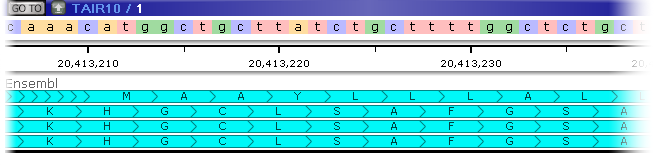
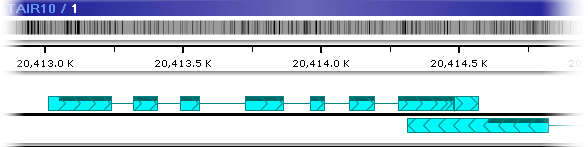
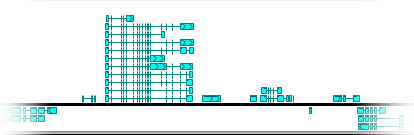
Zoom in to see individual annotations, including their exons, introns, and CDS regions (the track may once again automatically adjust its size to fit all the visible annotations):
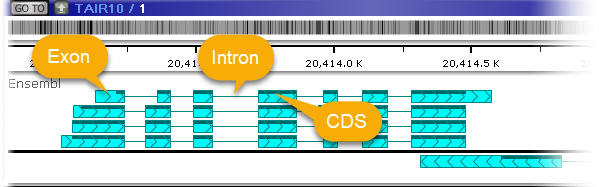
The thick bars marked with the "herringbone" pattern represent exons (the direction of the pattern points in the direction of the strand); the thin lines represent introns; and the dark bar across the top of the annotation represents the CDS (assuming the annotation has a CDS). Zoom in even further to display the protein translation for each transcript:
If you collapse the track while the map is zoomed in, annotations in a locus will be overlaid on top of each other, giving preference to the "most representative" annotation within each locus:
Typically, the "most representative" annotation is simply the longest one, but this behavior can be changed in PersephoneShell when creating annotation groups.
Move the mouse over an annotation on the track to display its tooltip balloon:
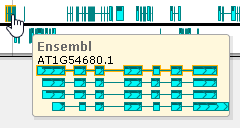
The tooltip balloon shows all annotations in the locus. The annotation directly under the mouse cursor is outlined in yellow, and its name is displayed at the top of the balloon.
Click any annotation to open the Annotation Details dialog (a.k.a. the "gene card"), which contains detailed information about the annotation, including its qualifiers, sequences, metrics, and any orthologs.
Additional display options
Right-click anywhere on the track to bring up its context menu:
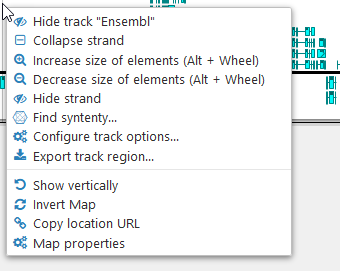
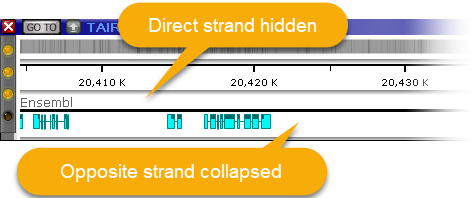
The Annotation track context menu provides some functionality in addition to the standard options available for every map and track. You can collapse or hide individual strands:
You can also manually adjust the size of the annotation elements:
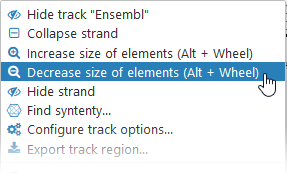
Alternatively, you can move the mouse over the track, then hold Alt and roll the mouse wheel (roll up to make the elements bigger, or down to make them smaller).
Note
The Alt + Mouse wheel shortcut may not work properly in Firefox.
Select Find synteny from the context menu to open the Find Synteny dialog, where you can find Annotation tracks on other maps that are orthologous to the current track.
Mixed-strand exons
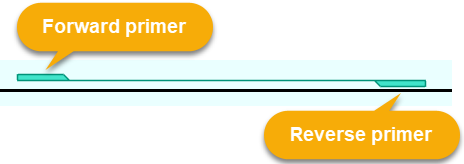
Some annotation features can contain fragments belonging to both strands. For example, you could import a GFF file containing primer pairs:
chr2 primer primer_match 2926080 2926229 . . . ID=t35883.M000061.1
chr2 primer match_part 2926080 2926101 . + . ID=t35883.M000061.1:fwd;Parent=t35883.M000061.1;Name=JMFN008E02;Primer_seq=gggggaatcgtgacagagttta
chr2 primer match_part 2926229 2926252 . - . ID=t35883.M000061.1:rev;Parent=t35883.M000061.1;Name=JMFN008E02;Primer_seq=ggaaagcttacaccagaaacggaa
Such features are shown on the Annotation Track with a special glyph, and are always positioned above the track's axis:
Optional features
The following features may not be available on all annotation tracks, as configured by the Persephone administrator.
Ortholog shadows
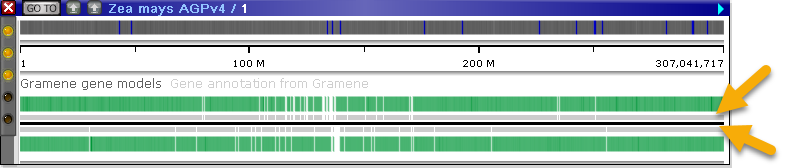
Annotation tracks can be optionally configured to display ortholog shadows, indicating the relative number of orthologs linked to each annotation. When the track is zoomed out, regions with orthologs are indicated by light gray rectangles next to the axis (on each strand):
You can zoom in to view these shadows in greater detail; it may also be helpful to expand the track to view individual transcripts:
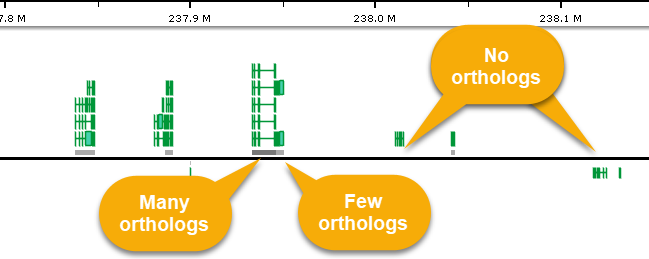
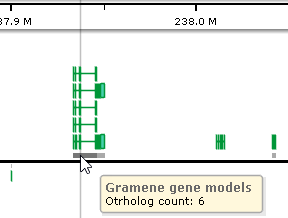
The more orthologs occur in a given region, the darker its "shadow" will appear in this zoomed-in view. Move the mouse over the shadow rectangle to see the exact number of orthologs linked to transcripts in its location (in a pop-up balloon). You can also click an individual transcript to view a detailed list of all of its orthologs in the Annotation Details dialog.
Quality marks
Annotation tracks can be configured to display gene quality marks for each transcript, based on the value of a specific qualifier (or a set of qualifiers). These marks appear as colored rectangles on the 5' end of the transcript:
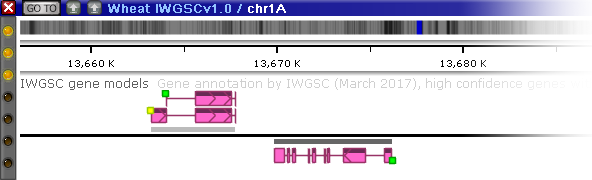
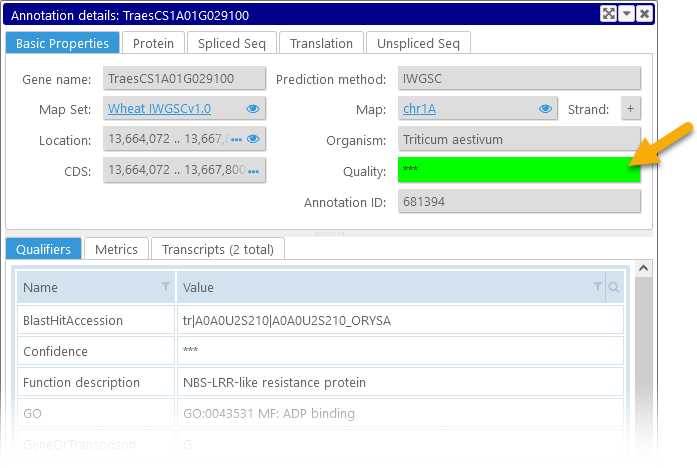
The color of each quality mark depends on the value of a pre-selected qualifier, as configured by the Persephone administrator. Typically the colors range from green (high quality) to yellow (medium quality) to red (poor quality); but any other color scheme could be configured as well. Annotation quality also features prominently among its properties in the Annotation Details dialog:
 Copyright © 2009-2024 by Persephone Software. All Rights Reserved.