Web Persephone: The Synteny track
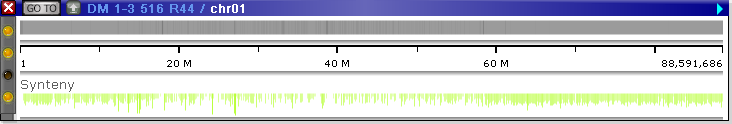
The Synteny track displays connection points for all available homology ribbon connectors between the current map and other maps. In collapsed mode, the track displays a condensed pile-up of all the ribbon intervals:
Expand the track to view individual ribbon intervals; after a short pause, the track will automatically expand to its full height:


Drag the bottom edge of the track to resize it:

As always, you can zoom in to see more detail:

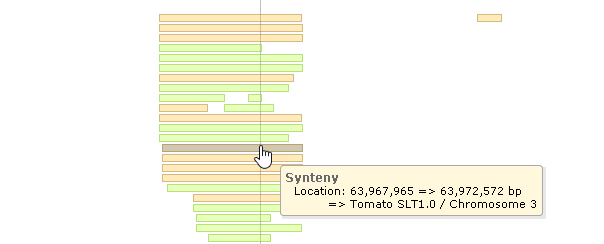
Each rectangular bar on this track represents the "shadow" of a homology ribbon attached to the current map. Shadows of direct (non-inverted) ribbons are typically drawn using cooler colors, while shadows of inverted ribbons use warmer colors (although you can change these colors in the Configure track dialog).
Mouse over a bar to display a tooltip balloon with its exact coordinates and target map:
Click the bar to open the target map. The map will appear below, and will be automatically brought into alignment according to the ribbon:

All ribbon bars connected to the newly opened map will be highlighted in a bolder color, and outlined with a darker border. You can click these bars to quickly scroll the connected map to the corresponding ribbon; you can also manually zoom out to view all the ribbons at a glance:
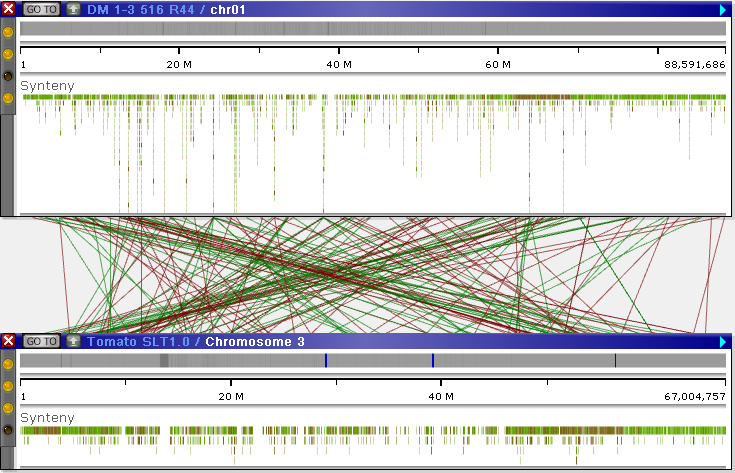
By default, inverted ribbons are shown in dark red, and non-inverted ribbons are shown in green; however, you can change these colors on the Display tab of the Settings dialog (by selecting Tools | Settings from the main toolbar):

 Copyright © 2009-2025 by Persephone Software. All Rights Reserved.