Web Persephone: The Variants track
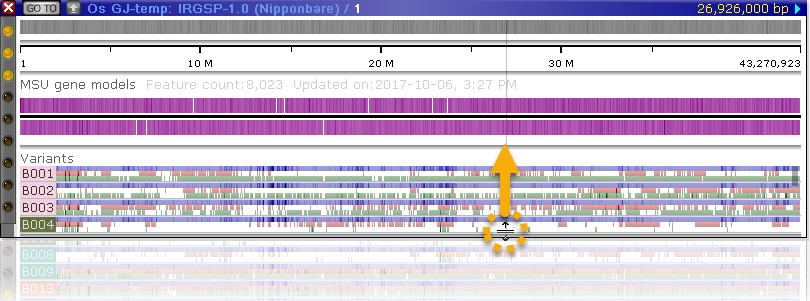
The Variants track is automatically appended to a map containing any samples that are currently selected in the Variants dialog:
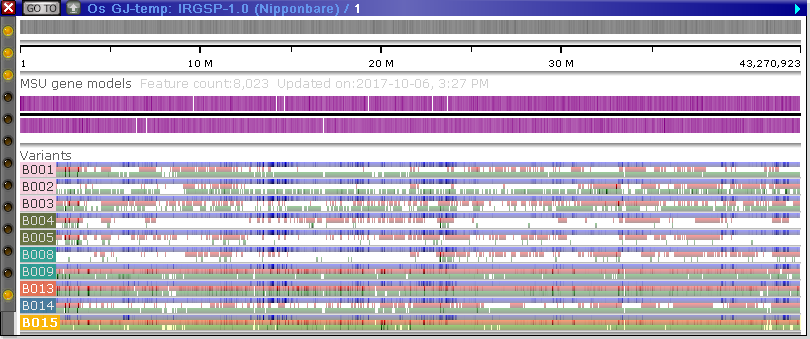
These samples will be presented in the same order as in the main table in the Variants dialog; likewise, their background colors and coloring schema will reflect the options configured in that dialog. The labels listing the name of each sample may obscure a portion of the view; however, if you mouse over the labels, they will jump to the other side of the map:
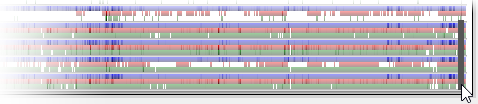
Hold down the Alt key and roll the mouse wheel to change the thickness of sample lines; for example:
Note
The Alt + Mouse wheel shortcut may not work properly in Firefox.
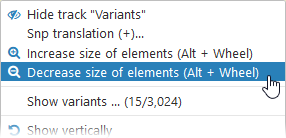
You can accomplish the same thing by selecting Increase/Decrease size of elements from the right-click context menu:
The track will automatically expand to display as many sample lines on one screen as possible. However, you can drag the bottom edge of the track to manually resize it:
When the track is not wide enough to contain all the sample lines, a scrollbar will appear on its right-hand side; drag the scrollbar to scroll through the samples:
You can also scroll the track my moving the mouse over it and rolling the mouse wheel.
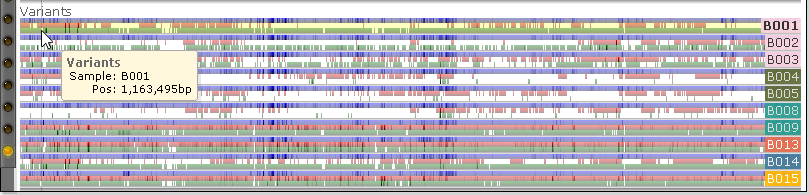
Zoom in on the map to view individual variants; zoom in further to view the alleles for each sample:
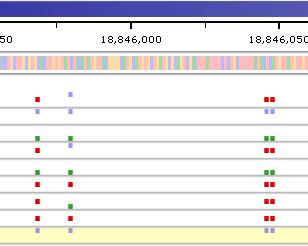
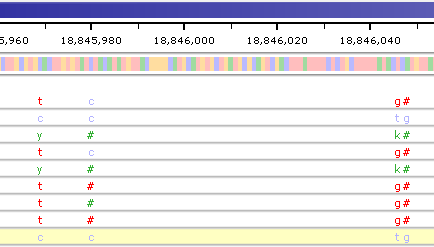
Homozygous SNPs that match the current reference (either the reference sequence, or the parent sample selected in the Variants dialog) are shown in blue; SNPs that differ from the reference are shown in red; and heterozygous SNPs are shown in green. Heterozygous alleles are printed using their IUPAC codes; indels are printed as '#' (hash signs). Mouse over any variant to see a tooltip balloon listing its alleles for the current sample (note that the current sample is highlighted with a yellow background):
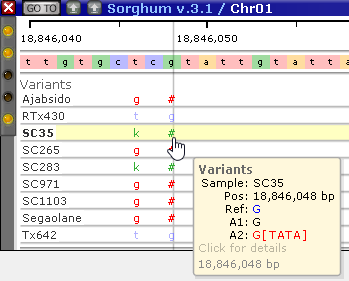
Click the variant to open the Local variants dialog, where you can examine this variant and its neighbors in greater detail.
You can change the set of selected samples, the coloring schema, and other options at any time by re-opening the main Variants dialog; any changes you make there will immediately take effect on the map.
Displaying translation changes
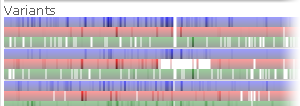
You can display one or more Annotation tracks alongside the Variants track. If these gene models have CDS regions specified (and the map is zoomed in sufficiently to discern individual exons), then you can move the mouse over the Variants track until you see a gray "shadow":

This shadow represents the region covered by the CDS of one or more transcripts that are currently visible on the same map. Right-click anywhere inside this shadow and select Translation changes (+) or Translation changes (-) from the context menu to open the Translation Changes dialog, where you can examine potential translation changes for the indicated strand in more detail.
Designing an assay
Right-click a variant and select Design assay sequences in visible region to open the Design assay sequences dialog, and pre-populate it with anchor sites representing all variants in the currently visible map region:

 Copyright © 2009-2025 by Persephone Software. All Rights Reserved.