Web Persephone: Editing gene annotations
Persephone provides a user-friendly interface for curating and editing gene annotations. Read on to explore all of its features in detail, or click here to see a practical step-by-step example.
Editing gene models
To edit a gene annotation, right-click it, and select Edit gene model from the context menu: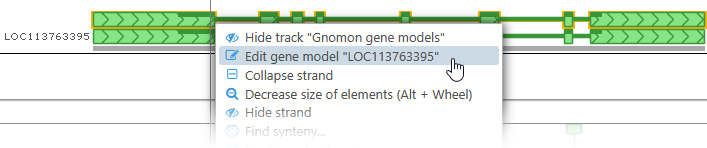
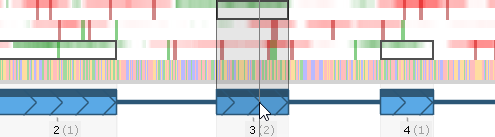
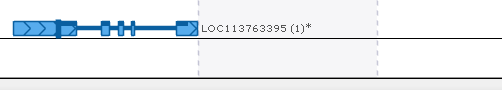
Alternatively, you can right-click on an empty spot in the track, or on a highlight, and select Create gene model to create a single-exon gene model from scratch: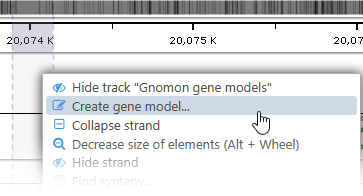
Note
Clicking above the Annotation track's axis will create a new single-exon annotation on the (+) strand; clicking below the axis will create the annotation on the (-) strand.
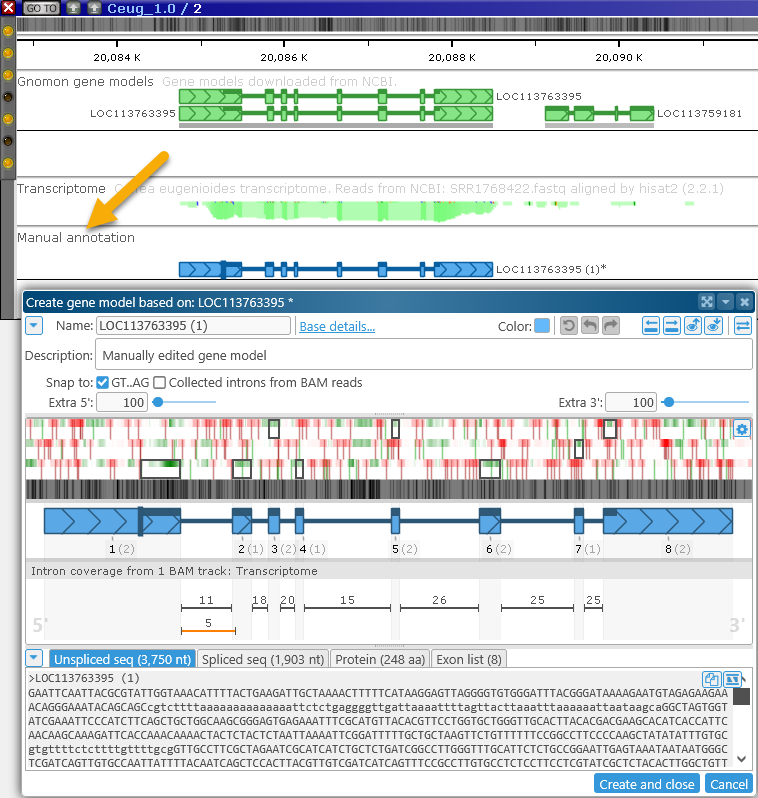
Doing so will reveal the Manual annotation track, and open the Edit gene model dialog:
This gene editing functionality is currently only available to logged-in users; anonymous users can view edited annotations, but cannot make edits of their own.
Note
The free public version of Persephone (https://web.persephonesoft.com) does not currently allow edited genes to be permanently saved.
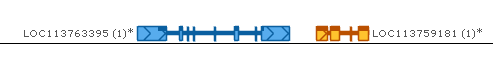
The Manual Annotation track
Gene annotations on the original Annotation track are never affected by edits; instead, their edited copies appear on the Manual annotation track. These edited copies are visible to everyone with access to the current Persephone instance. If you are using the free public version of Persephone, the edited annotations are visible by everyone on the Web; if you have deployed Persephone locally, the edits are only visible to users within your organization. You can make repeated edits to your own manual annotations, but re-editing other users' manual annotations will always cause a fresh copy to be created.
Modifying the exon-intron structure can be done in the editor form or directly on the Manual annotation track, by dragging exon boundaries while the editor window is still open.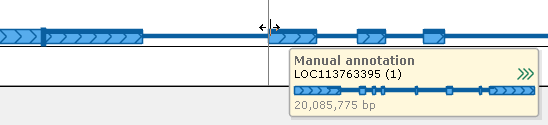
Editing annotations directly on the track can be helpful when you wish to consider the bigger picture, or when you need to examine multiple sources of evidence (e.g. BAM reads, quantitative tracks representing RNA-seq coverage, or BLAST hits). All of the edits you make on the track will be reflected in the Edit gene model dialog (and vice versa).
The Edit Gene Model dialog
This dialog opens automatically whenever you begin to edit an existing gene annotation, or when you create one from scratch (as described above). Your edits will not be permanently saved until you click the appropriate button in the dialog (Create and close or Save and close). The dialog consists of several sections:
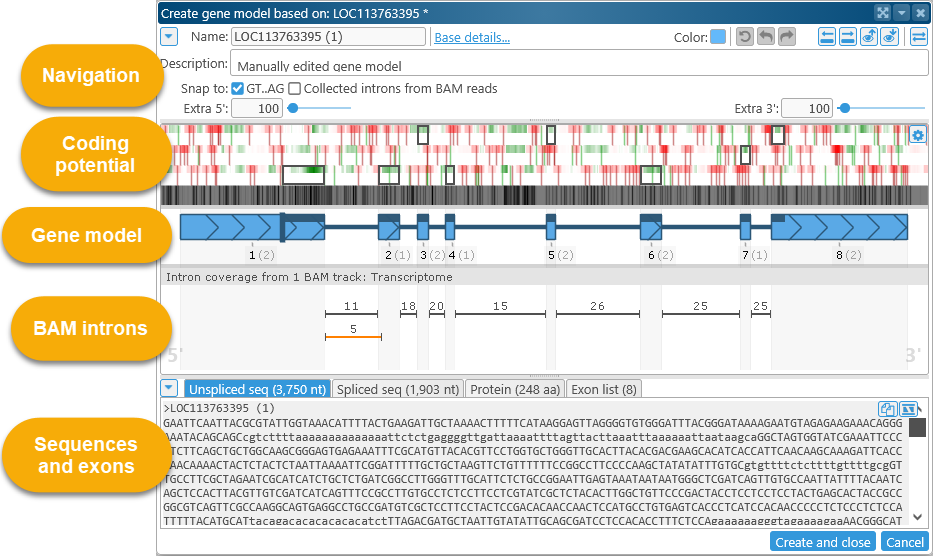
Navigation
This section displays the basic properties of the edited gene annotation, as well as some navigation controls. Click the  button to collapse this section into a single line (to leave more room on the screen for other controls):
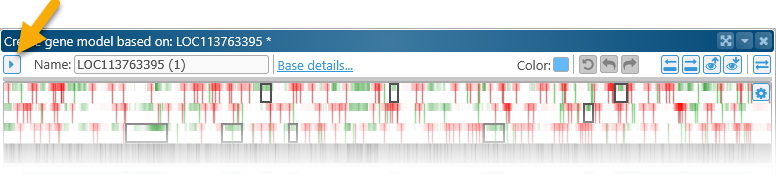
The controls (listed left to right) work as follows:
- Name: Enter a new value here to rename the edited gene annotation. The annotation's name will be updated when you click the Save and close (or Create and close) button.
- Base details: Click this link to open the Annotation details dialog for the original annotation, where you can review its properties, metrics, qualifiers, etc.
- Color: Click the color swatch to change this gene annotation's color. Each annotation may have its own color:
 Reset: Undo all the changes made since the last time this gene annotation was saved.
 Undo: Undo the most recent change; you can also press Ctrl-Z to undo.
 Redo: Redo the most recent change; you can also press Ctrl-Y to redo.
 Previous / Next exon: Click these buttons to quickly scroll through the exons in this dialog:
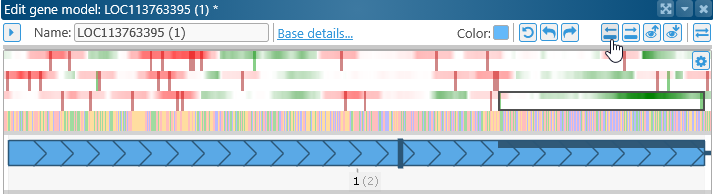
 Zoom map to dialog: Scroll and zoom the map so that it shows the same region as the one displayed in the dialog:
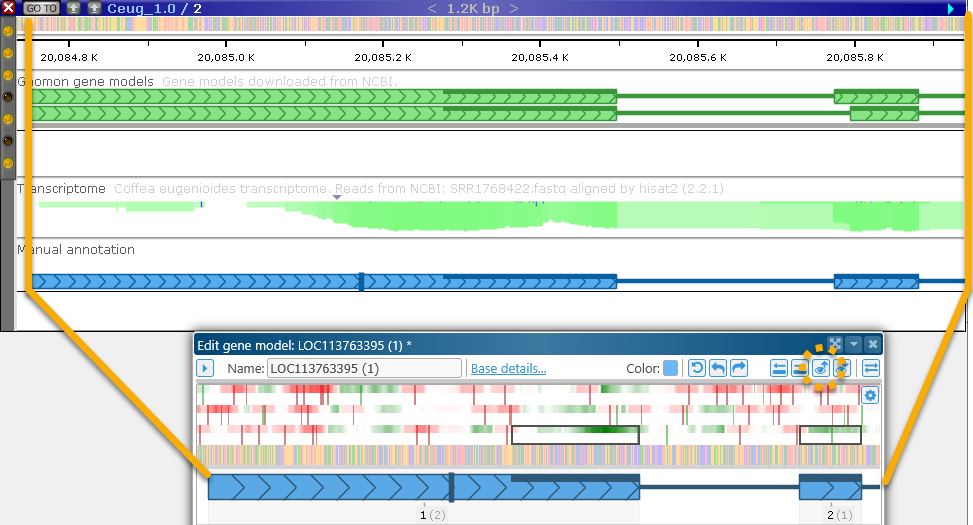
 Zoom dialog to map: Scroll and zoom the gene model in the dialog so it displays the same region as the one that is displayed on the map.
  Invert map: Gene annotations in this dialog are always shown in direct orientation, even if they reside on the opposite strand. If that is the case, click this button to invert the map, so that the gene model on the map and the gene model in the dialog are displayed in the same orientation (5' end on the left, 3' end on the right).
The remaining controls contain the edited gene annotation's description, as well as some navigation options:
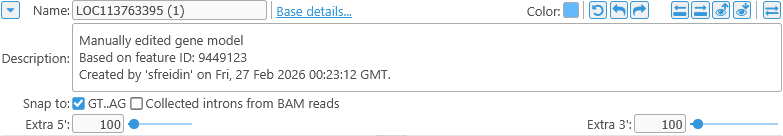
- Description: The description for each manually edited gene annotation is auto-generated, but you can edit it here (e.g. to provide an explanation of the edits).
- Snap: When editing exons, causes the mouse cursor to snap to canonical splice junctions (GT..AG) and/or the intron boundaries extracted from BAM reads. This functionality is described in more detail below.
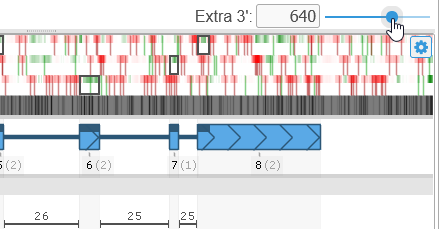
- Extra 5' / Extra 3': Grabs extra nucleotides from the upstream/downstream regions near the annotation and displays them in the dialog. Use these controls if you wish to extend the annotation beyond its present boundaries:
Note
Currently, these values are limited to at most 1,000 nucleotides.
Coding potential and reference sequence
The next section displays the color-coded reference sequence, as well as protein coding potential in 3 frames: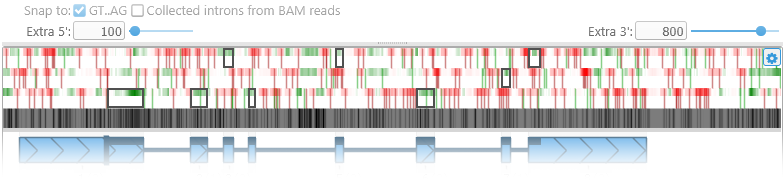
Place the mouse cursor over this section and roll the mouse wheel to zoom in and out, or drag with the left mouse button to pan the view (just as you would pan and zoom the map):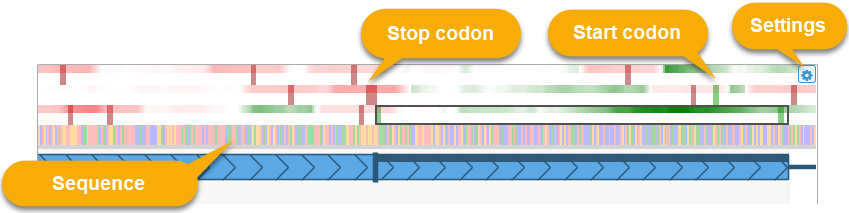
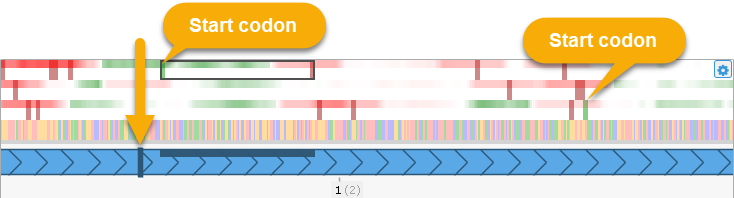
The green-and-red heat map represents protein coding potential in all 3 reading frames (green if the sequence is likely to be protein coding, red if it is likely to be non-coding). The thick vertical dark red bars indicate stop codons in their respective reading frames. Similarly, thick green lines indicate start codons. The start codon motif depends on the map's protein translation table: on most maps the start codon motif is "ATG", but it could be e.g. "TTG" or "CTG" on mitochondria.
Black rectangles outline the protein-coding segments of the model's exons, in their respective reading frames.
Click the  button in the upper-right corner to edit heat map colors and the smoothing window size for coding potential calculations, or to turn off some (or all) of the coloring options. For example, you might wish to turn off the start/stop codon indicators to emphasize the coding potential heat map:
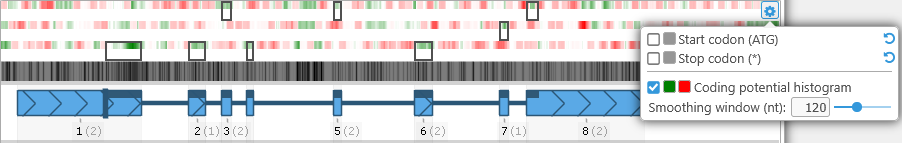
The reference sequence is displayed underneath the coding potential plot. When the gene model is zoomed out, the sequence is displayed as a GC-content histogram (similarly to how it's shown on the GC-Content track). Zoom in to see individual nucleotides rendered in their specific colors (as shown above); zoom in further to fully display nucleotides and amino acids: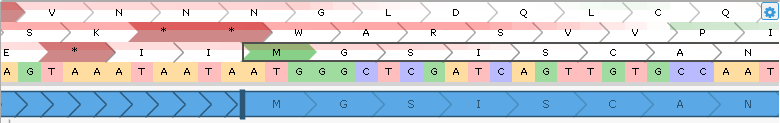
Gene model representation
The current gene model is displayed underneath the sequence: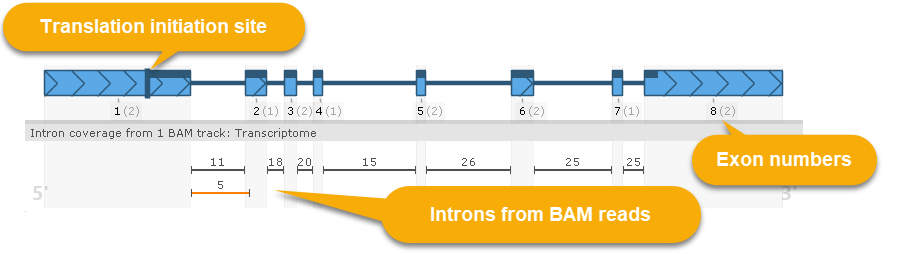
The model is always displayed in direct orientation, even if it resides on the 3' strand. This model is displayed similarly to gene model glyphs on the Annotation track: the thick herringbone-pattern rectangles represent exons; thin lines between them represent introns; and the dark bar at the top represents CDS. However, this view provides some additional details:
- The dark vertical bar on the left side of the model indicates the translation initiation site; this would typically match the location of the start codon, but can be changed (as described below).
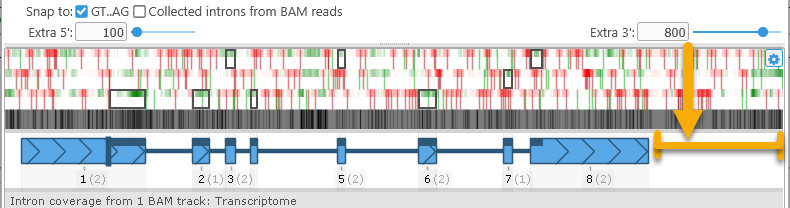
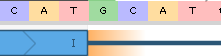
- The black numbers underneath each exon display its exon number (starting with Exon #1); these are followed by gray digits (in parentheses) displaying the exon's frame-shifting ability (i.e. the remainder of dividing its length by 3). The protein-coding segments of each exon (i.e. those that fit within the gene's model's CDS) are outlined in black rectangles on the coding potential plot. Mouse over an exon to display a dark "shadow" over the plot, emphasizing the exon's location:
- Some maps may contain BAM files with intron-spanning reads (e.g. RNA-seq or ISO-seq). If such tracks are present and visible on the map, their introns will be stacked up under the gene model:
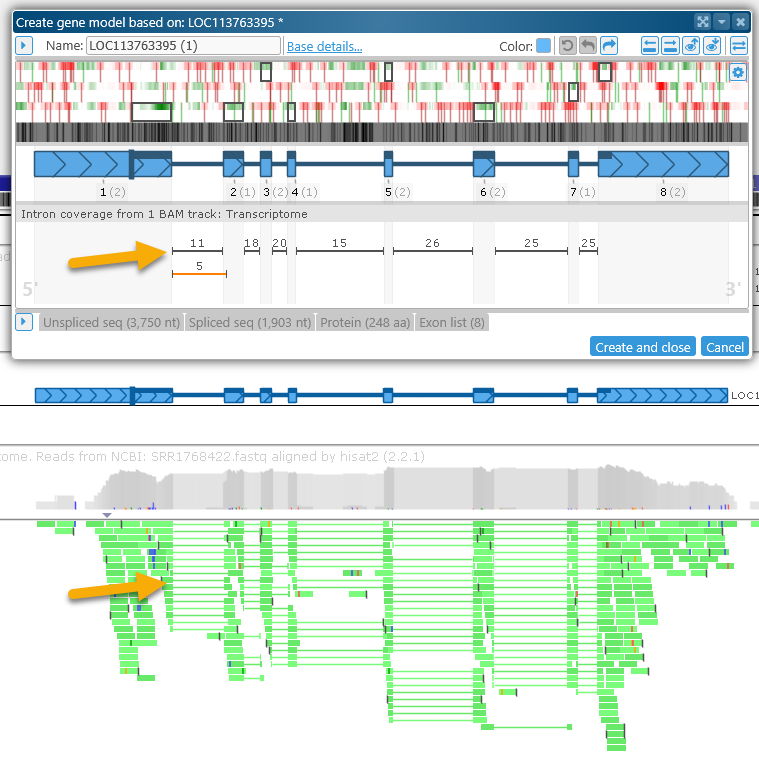
The number above each intron indicates the number of reads supporting it. Introns whose splice sites are identical to those of the current gene model are shown in black; introns with different splice sites are shown in orange. If the intron flanking dinucleotides are non-canonical (anything other than GT..AG), they will be marked in either orange (AT..AC, GC..AG) or red (any other combination of dinucleotides):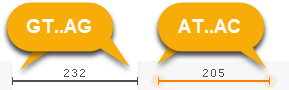
Basic editing controls
To adjust an exon boundary, simply drag it with the mouse: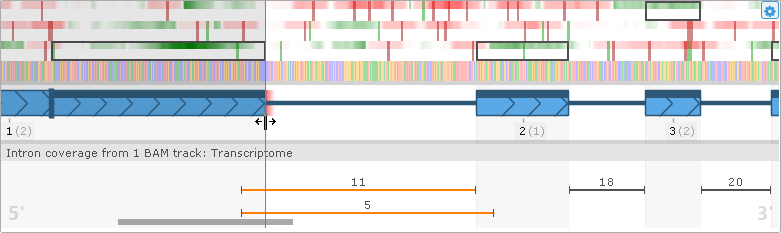
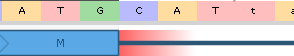
As you drag the exon boundary, the plot will update in real time; notably, the CDS will be adjusted to conform to the new open reading frame. If the resulting splice sites are non-canonical (anything other than GT..AG), they will be highlighted in either orange (AT..AC, GC..AG), or red (any other combination of dinucleotides):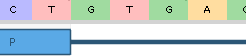
When the gene model is zoomed out, exon boundaries will snap to either canonical splice sites (GT..AG), or introns from BAM reads, or both (as determined by the snapping settings, described above).
If introns from BAM reads are present, you can mouse over an intron indicator to highlight its location...
...and then double-click it to apply its splice sites to the gene model: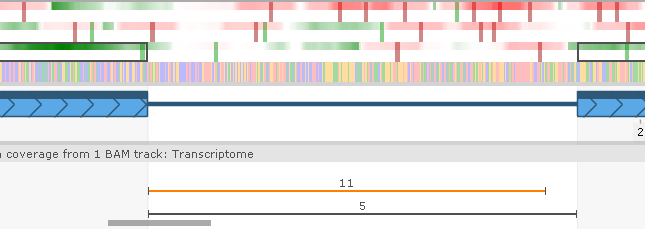
To merge two exons, drag a splice site until one exon touches the other: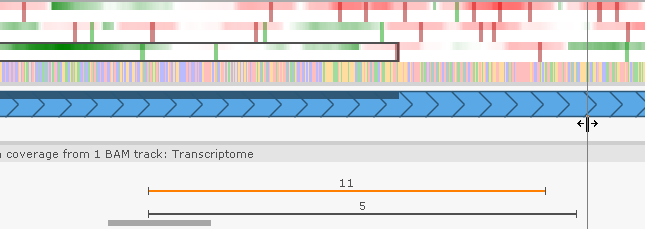
To re-introduce an intron, right-click on an exon and choose Add intron from the popup menu: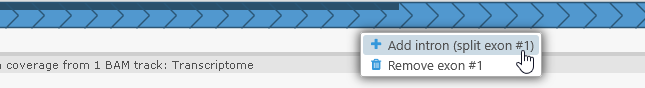
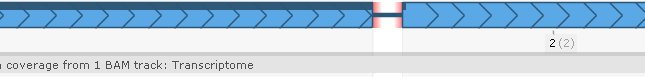
Doing so will create a small intron (spanning 20 nucleotides or smaller), allowing you to once again drag the splice sites to their proper locations. You can also select Remove exon from the same menu to delete the exon entirely.
Similarly, right-click anywhere within an intron and select Add exon from the popup menu to re-introduce a short exon; or select Remove intron to remove the intron entirely (thus merging the two flanking exons).
The dark vertical bar at the 5' end of the gene model represents the translation initiation site (i.e. the start of the gene's CDS). Drag it to change the CDS: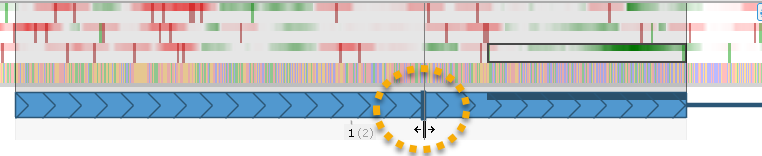
Note that the CDS will always begin at the first available start codon that is downstream of the proposed translation initiation site. Thus, dragging the site may have no effect until it is dragged far enough to capture a different start codon: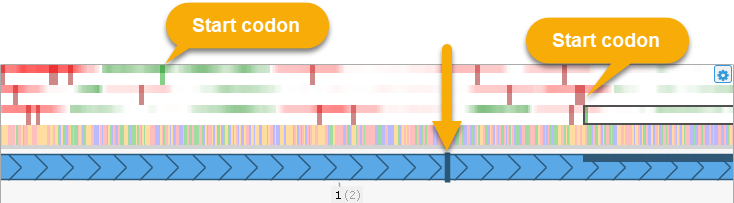
As you can see above, the CDS will always be automatically recalculated to start at the first available start codon, and to end at the closest stop codon within the current reading frame.
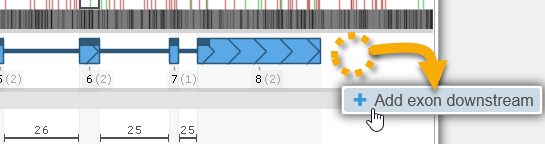
To add a new exon to the annotation, adjust the Extra 5'/Extra 3' controls to allocate more space upstream or downstream of the annotation, then right-click in the empty space (outside of the gene model), and select the Add exon option from the popup menu. For example, you could introduce a new downstream exon: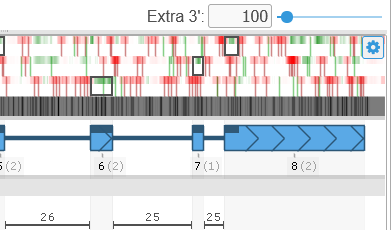
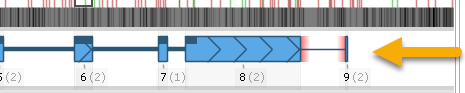
You can now edit the newly created exon by dragging its boundaries as usual.
Advanced editing controls
As mentioned above, you can drag exon boundaries, and introduce exons or introns, directly on the Manual annotation track; any edits you make will be synchronized to the Edit gene model dialog (and vice versa). In addition, while the the Edit gene model dialog is open, you can perform some advanced edits from the map's context menu.
For example, you can define a highlight (by Ctrl-dragging the mouse over a map), then right-click inside the highlight on the Manual annotation track and select Make exon from highlight from the popup menu to create a new exon. If the highlight is defined outside of the gene model, doing so would extend the gene model by appending the newly created exon to it: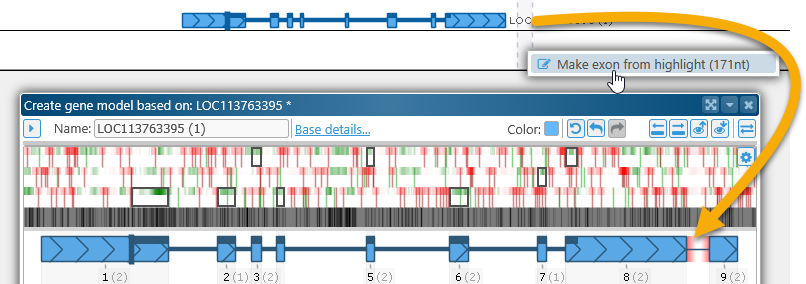
You can also use this technique to create a new gene model from scratch.
On the other hand, if the highlight partially covers the current gene model, select Trim gene model from the popup menu to delete all of the exons and introns that are covered by the highlight and trim your gene model to the highlight's boundaries: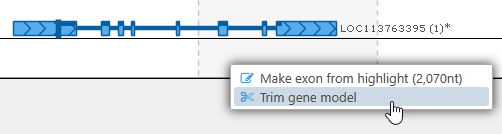
You can also right-click any gene annotation (either on the Manual annotation track, or any other Annotation track), and select Merge exons from gene model from the popup menu to apply that gene annotation's exons to your own gene model. Doing so could allow you to merge two genes: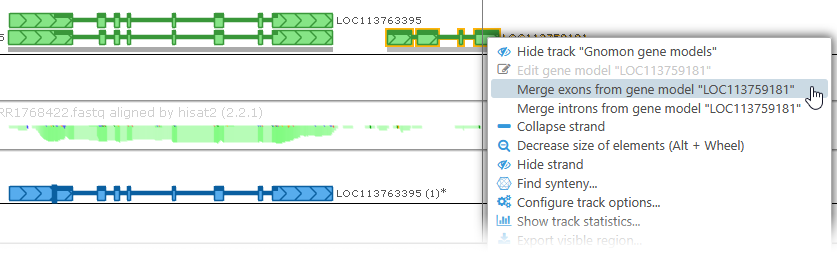

Sometimes gene models are accidentally attributed to the wrong strand. To create a copy of the gene model on the opposite strand, right-click it, then select Advanced edit options | Create gene model on opposite strand from the popup menu: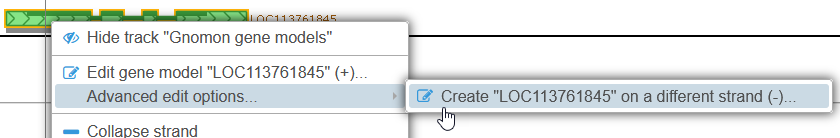
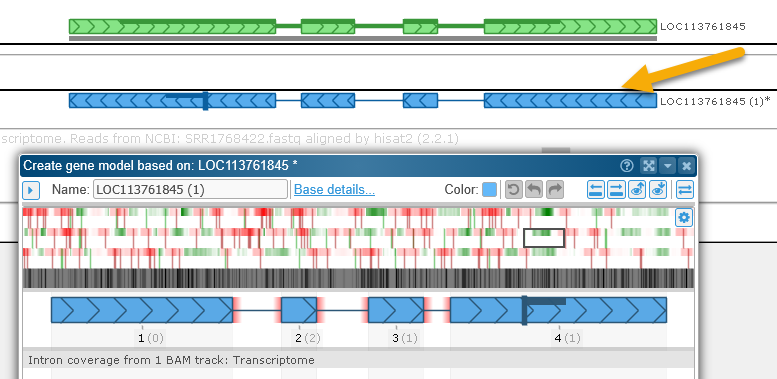
Note that in this example the original gene model was placed on the correct strand to begin with, and thus the splice sites of the inverted gene model turned out to be non-canonical, and are highlighted in red.
Sequences and the Exon List
The bottom section of the dialog contains several tabs listing all of the current gene model's sequences (unspliced sequence, spliced sequence, and protein translation), as well as the full list of its exons. All of these are updated every time the gene model is edited.
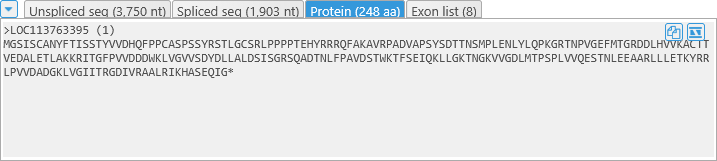
As usual, you can click the button to collapse this section if you wish to save some room on the screen. As in the regular Annotation details dialog, you can click the  button to copy a sequence to the clipboard, or the
  button to BLAST it.
Click the Exon list tab to display the full list of the gene model's current exons: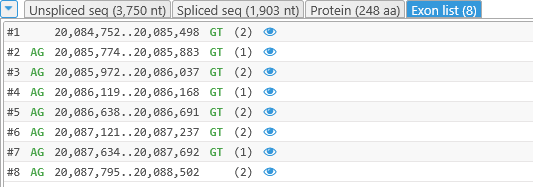
Each line in this list represents a single exon and contains the following fields:
- The exon's number
- The intron-flanking dinucleotide preceding the exon.
- The exon's starting and ending coordinates.
- The intron-flanking dinucleotide following the exon.
- The exon's frame-shifting ability (remainder of dividing its length by 3). If an exon's length is a multiple of 3 (the remainder is 0), skipping such an exon will not change translation of the exons downstream.
- The
 button; clicking this button will zoom both the map and the Edit gene model dialog to the exon's location.
The intron-flanking dinucleotides are color-coded as described above; for example, splice sites that are likely invalid are colored in red: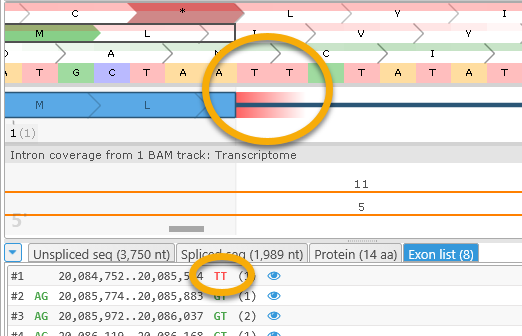
 Copyright © 2009-2025 by Persephone Software. All Rights Reserved.