Web Persephone: The Local Variants dialog
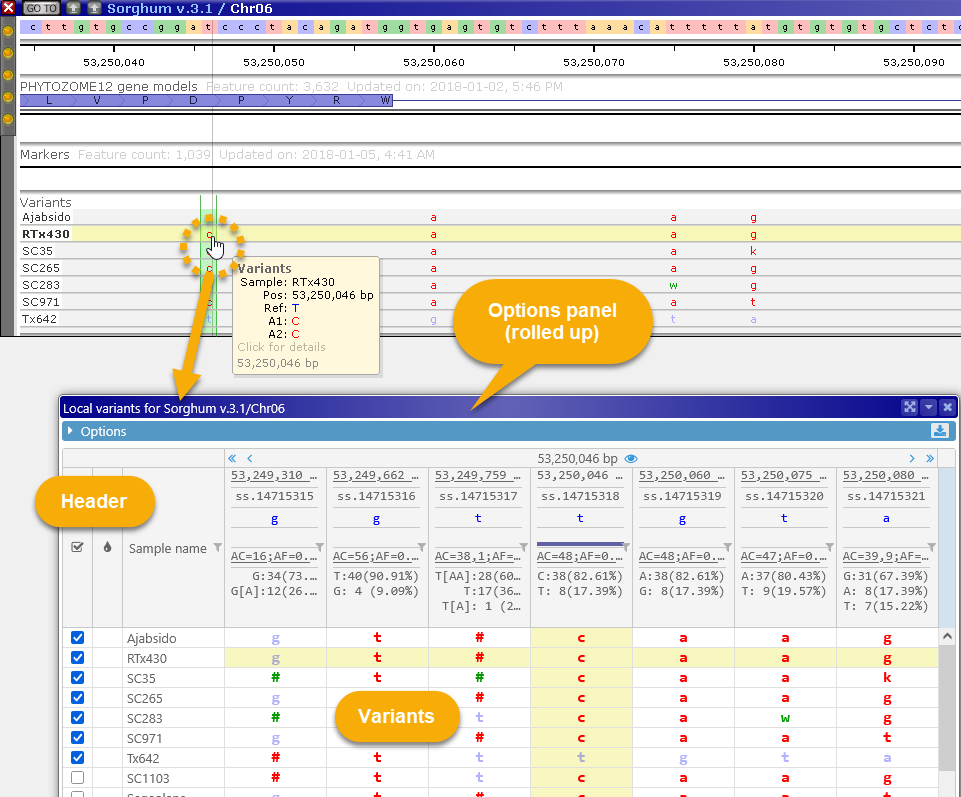
The Local variants dialog displays detailed information about all available variants (SNPs or indels) in a small region on a map. To open the dialog, click a variant on the Variants track:
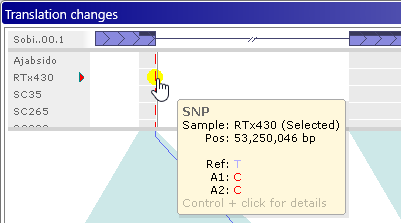
You can also do so by Control-clicking a variant in the Translation Changes dialog:
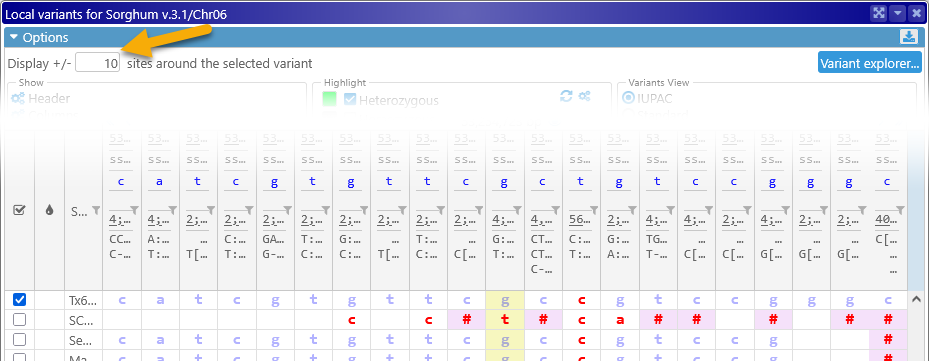
The Local variants dialog displays all variants in the current map "neighborhood" as a table. Samples are listed horizontally as rows and variants are shown as position-based columns (just as they are on the track). By default, the current variant is highlighted with a yellow background; its location on the track is also highlighted with a light green background, and you can click a table cell to highlight a different sample (while keeping the current variant site the same). Likewise, you can click a different variant on the map to select it and center the table of variants around its location.
Header
The header at the top of the dialog displays summary information about the variants at each position, as well as some navigational controls. Its appearance can be customized in the Options panel (as described below).
Navigation
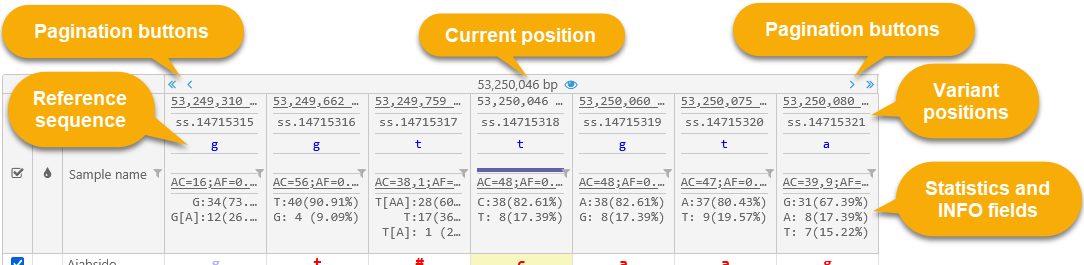
The navigation bar at the top of the dialog displays the positions of the variants in the current neighborhood. 
The position of the currently selected variant is displayed at the top; click the  button to scroll the map to it. The positions of other variants are displayed underneath. By default, up to three variants upstream and downstream of the currently selected variant are shown, but this number can be changed in Options. The ID of each variant is displayed underneath its position (assuming it was provided in the original VCF file). If there's not enough room on the screen to display the entire position, you can mouse over it to reveal its tooltip:
Click the pagination buttons at the top of the header to quickly scroll through the variants: the  (or
(or ) buttons scroll to the adjacent variant on the left (or the right), and the
  (or
(or  ) buttons scroll the entire page. As you scroll through the variants, the highlighted position on the map will follow your selection:
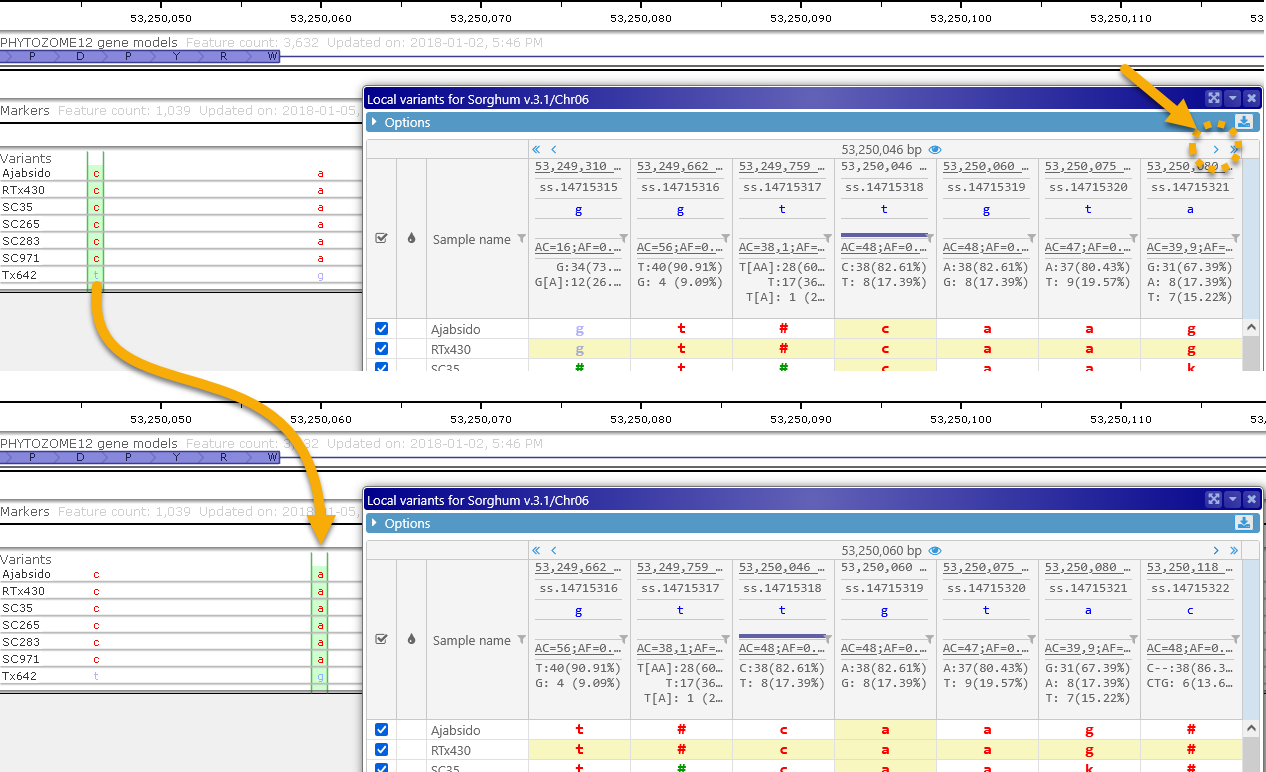
You can also click one of the underlined variant positions (in the top row) to scroll directly to that variant.
Reference sequence
The reference sequence row displays the reference sequence's bases at each variant position.
Note
The Reference row always shows the reference sequence, even if the coloring schema is set to Reference genotype or Two parents.
The colored bars underneath each reference base indicate variant positions that fall within a gene transcript's CDS (as shown on an Annotation track on the current map). If there are multiple Annotation tracks visible on the map, each track will be indicated by a bar in its corresponding color:

You can mouse over a colored bar to display a tooltip listing the name of the associated Annotation track and its transcripts: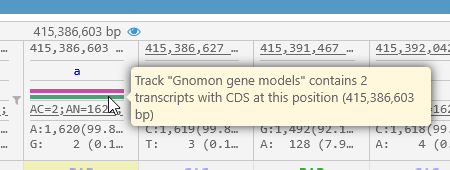
Allele statistics
The bottom row of the header displays summary statistics about alleles at each position.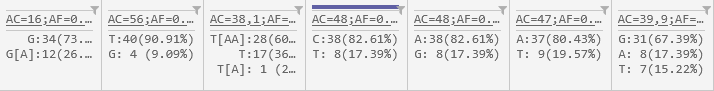
If the original VCF files contained any INFO fields, these will be displayed above the allele statistics. You can mouse over an INFO box to display its entire contents: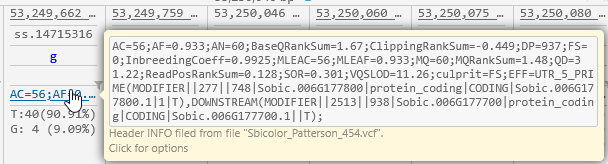
But it might be more useful to click the box, and select a subset of the fields to be shown in the header. For example, you could display only DP (read depth) and QD (quality by depth):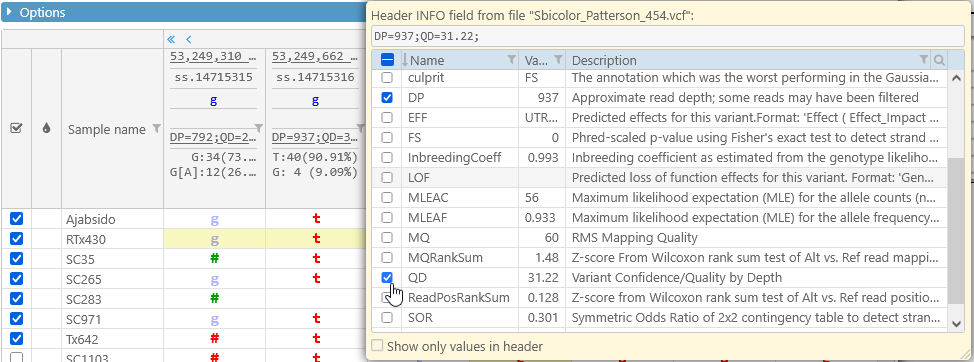
As usual, you can search and filter the list of fields to quickly find the ones you're interested in:
You may also wish to check the Show only values in header checkbox to hide the field names, and only display their values, so that you can fit more of them on the screen: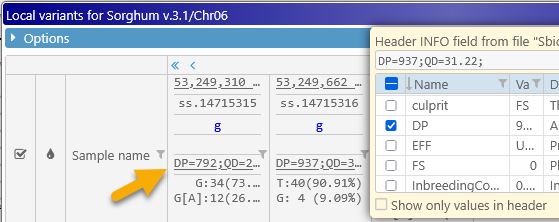

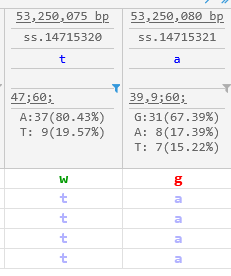
Finally, allele count statistics are displayed at the bottom of the header, showing all of the possible alleles at each location, along with the count and relative frequency of occurrence for each allele. As usual, you can mouse over a table cell to display a tooltip with its full contents: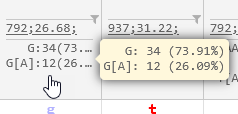
Note
The allele counts include statistics for all available samples at each location, regardless of whether or not they are selected in the Variant Explorer.
Variants that change the protein translation for one of the transcripts on the map are outlined with a pink border: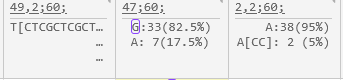
Sorting and filtering the samples
You can click any column in the header to sort the displayed samples by that column. For example, you can sort the samples by allele at a specific position: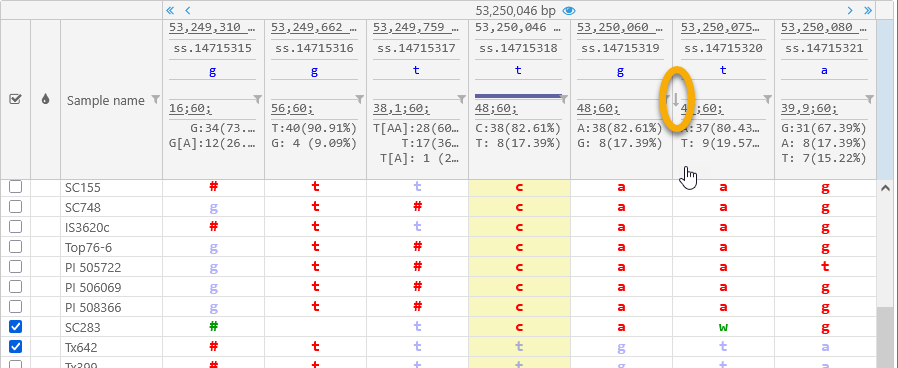
Click the column again to reverse the sort direction, and then a third time to return to the default sort order.
In addition, you can click the  button next to a variant position to show only those samples that possess a specific allele value at that position. For example, you could show only the samples with T/T or T/A at 53,250,080 bp (thus hiding the remaining 18 samples with A/A):
Variants
The bulk of the dialog is occupied by the table of variants. Table rows represent samples, columns represent positions on the genome, and each table cell contains the sample's allele calls at that position. 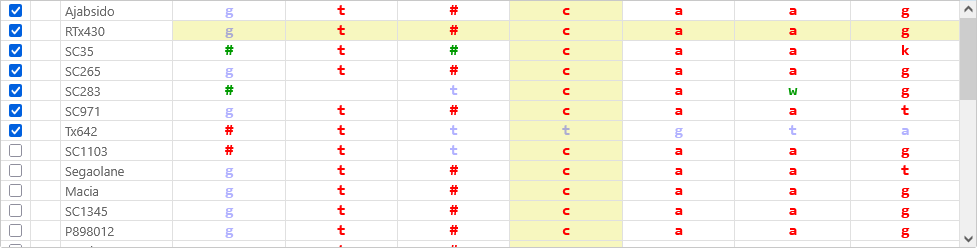
By default, samples that are currently selected in the Variant explorer (and therefore visible on the Variants track) are listed at the top of the table. You can toggle the checkboxes to quickly add or remove samples from the current display set. You can also click any column in the header to sort the samples by that column, e.g. sample name, qualifier value, or allele call.
Click the color swatch next to a sample name to mark it with a custom color (for ease of recognition); this color will be reflected on the Variants track as well as in the Variant explorer: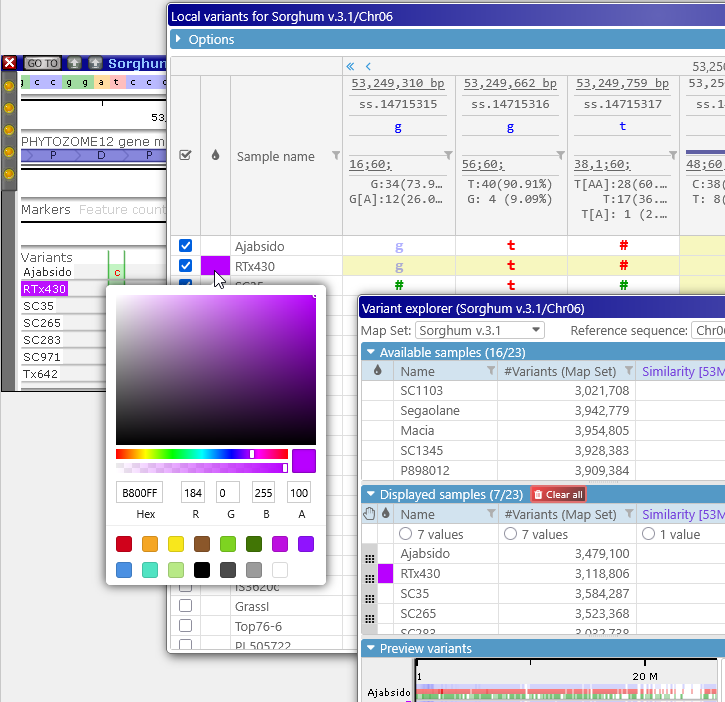
By default, variants identical to the reference are shown in blue; those different from the reference in red; and heterozygous variants in green. Mouse over a variant to view its detailed allele calls; this is especially useful for indels: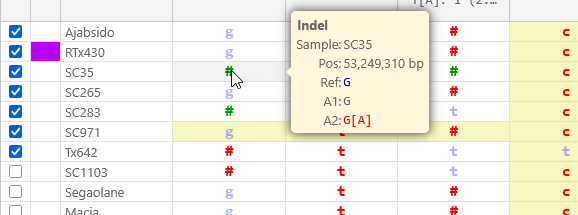
If a variant changes the protein translation of one of the transcripts on the map, it will be outlined in pink, and its tooltip will indicate which of the possible alleles causes the translation to change: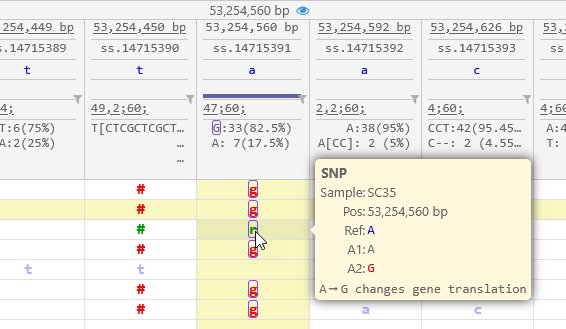
Note
To see more details about the translation changes (including those caused by indels), open the Translation changes dialog.
Samples that belong to VCF files imported into the local browser session are highlighted in light pink; these samples will disappear once the current browser tab is closed.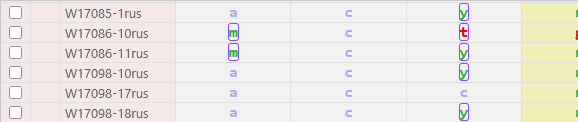
By default, variants are displayed by their IUPAC codes (just as they are on the Variants track); indels are indicated as #. This compact representation can be altered in the Options panel (as described below) to provide more information at a glance; for example: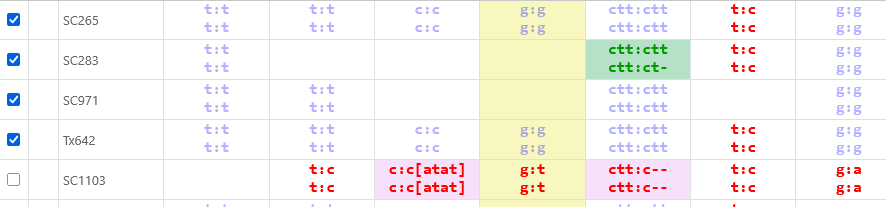
Options
The Options panel is collapsed by default; click the  button to expand it:
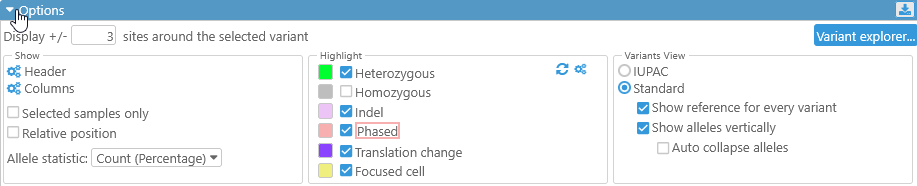
The input box in the top row of the Options panel controls the number of variant sites that are displayed around the currently selected variant (and thus the number of columns in the table):
The button on the right-hand side acts as a quick shortcut to the Variant explorer.
All remaining options are grouped into three sets: Show, Highlight, and Variants view.
Show
Use these options to show or hide additional information about the currently selected samples.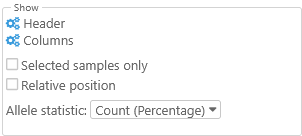
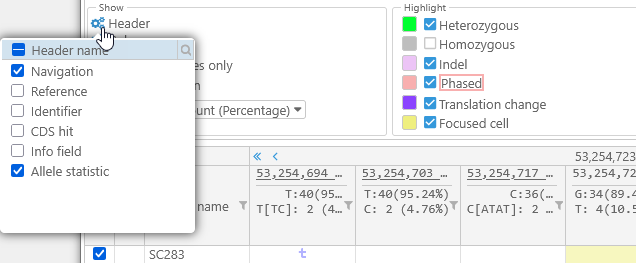
- Header: Click this button to hide (or show) specific elements of this dialog's Header:
- Columns: Click this button to choose which columns are displayed in the table (in addition to the variants themselves). By default, only the sample names and their color swatches are displayed; however, if the original VCF file included additional metadata qualifiers for each sample, you can choose to show them in the table:

You can then filter or sort the samples by the values of these qualifiers; for example, you could only show the samples with the "CHS" Population code: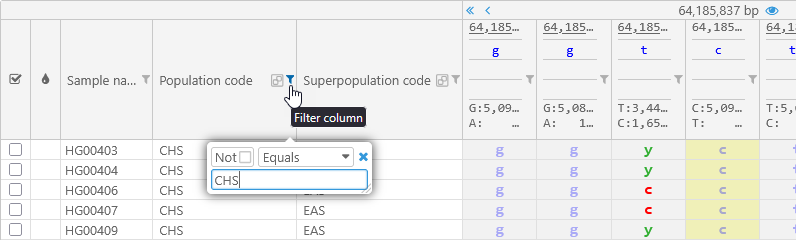
You can also group the samples by the value of a column. For example, you can group by the Population code; the grouped column will move all the way to the left: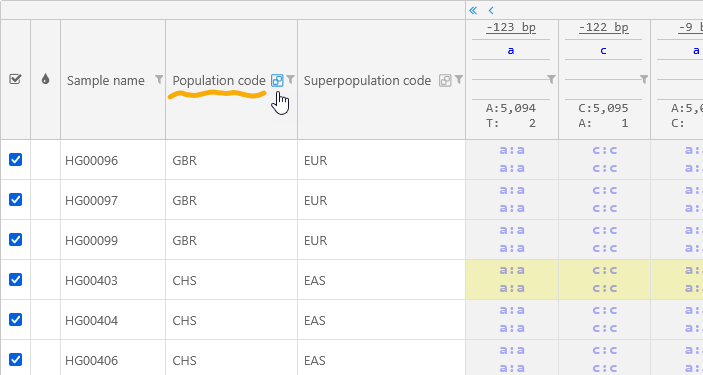
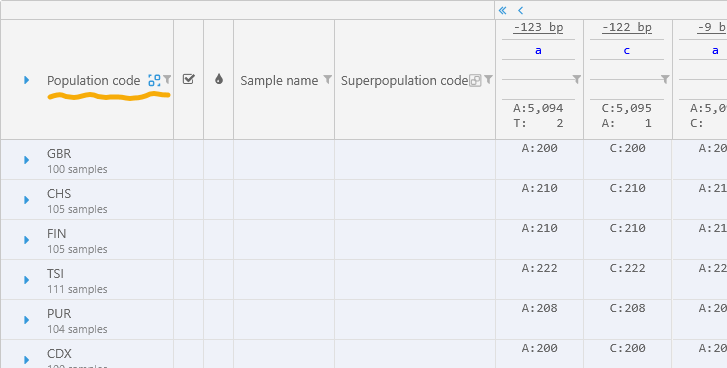
Click any group to expand it and view all of the samples within: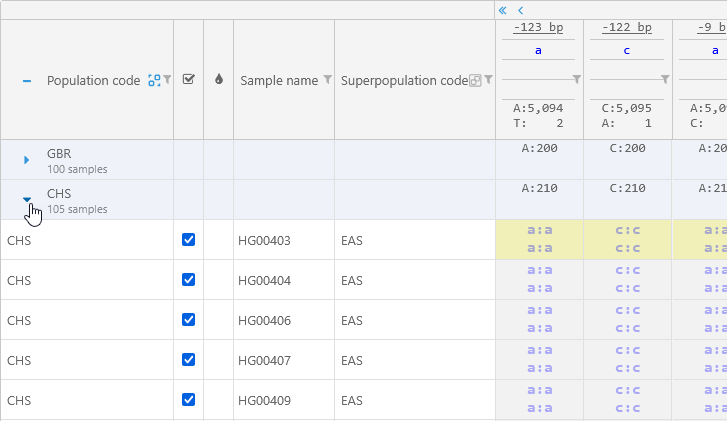
- Selected samples only: Hides any samples that are not currently selected in the Variant explorer (by default, all samples are shown).
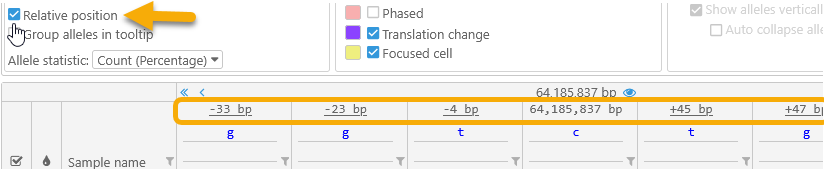
- Relative position: Changes the position display above each variant site to display only the relative offset from the currently selected variant, as opposed to the full position as measured from the start of the map:
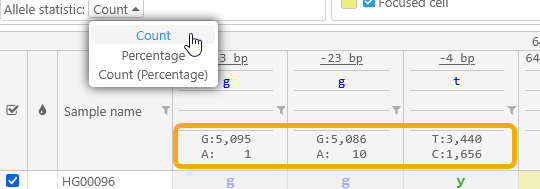
- Allele statistic: Toggles between displaying allele counts, relative allele frequencies, and allele counts followed by their frequencies (in parentheses):
Highlight
Use these options to highlight variants of interest in different colors.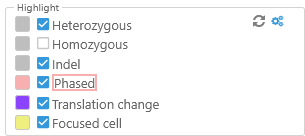
For example, you could highlight heterozygous variants in light green, highlight indels in light pink, and hide the highlighting for the currently selected variant site: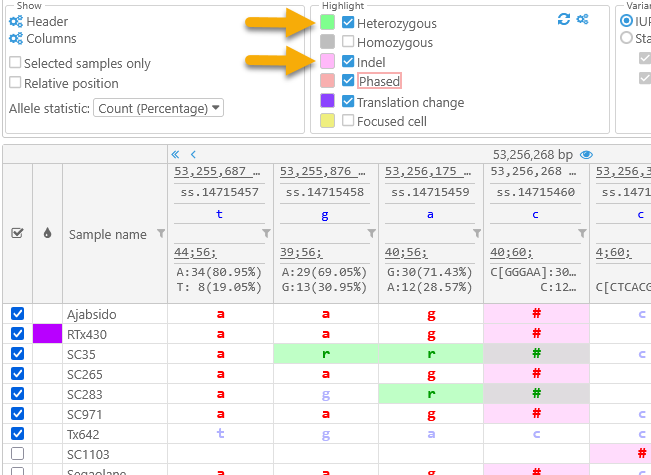
Note that highlight colors can overlap (as in the case of heterozygous indels in this example).
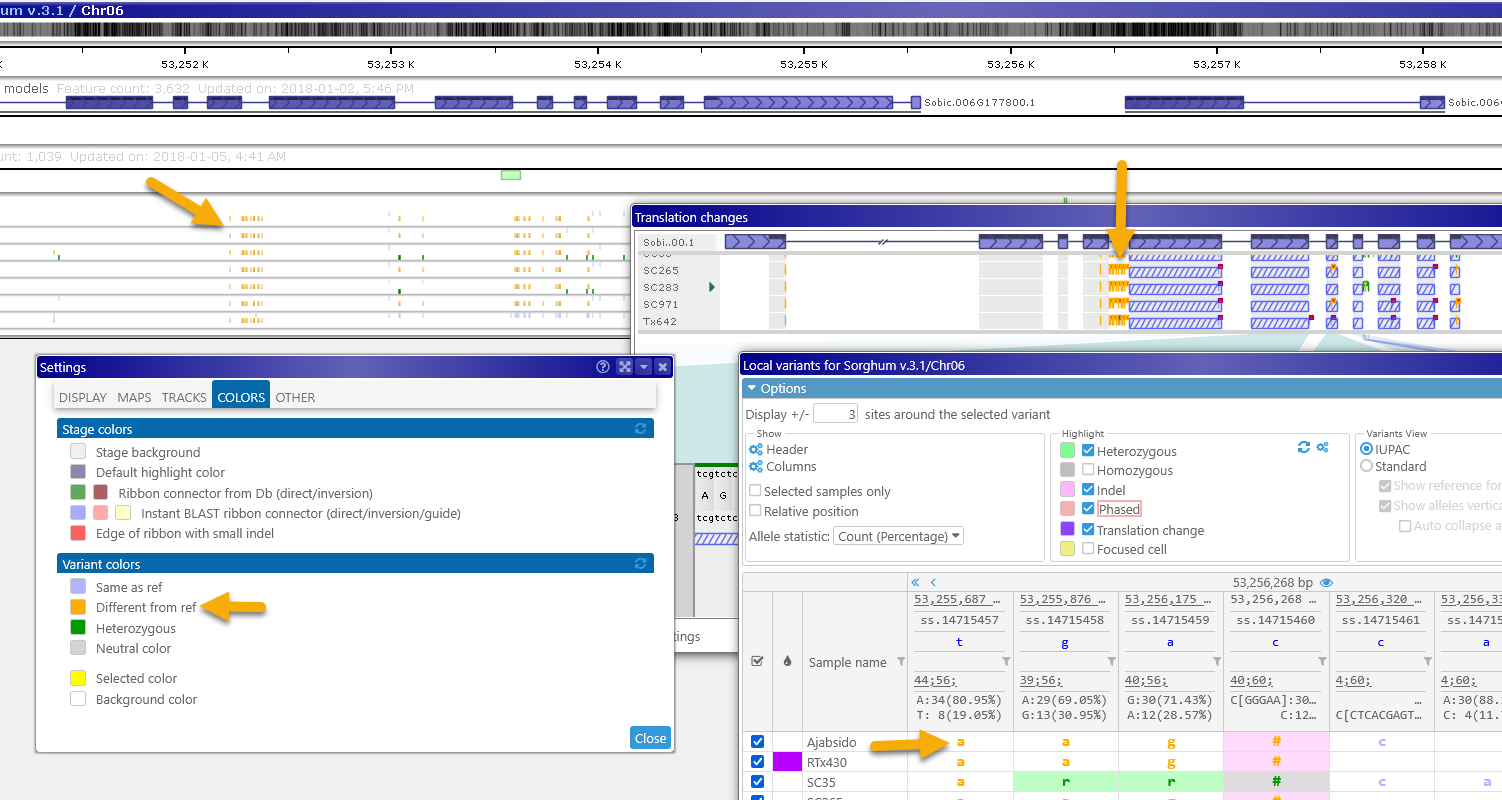
Click the  button to reset highlight colors to their defaults; click the
  button next to it to open the Settings dialog, where you can customize the colors of the variant alleles. The changes made in the Settings dialog will also take effect in other views, such as the Variants track and the Translation changes view:
Variants view
Use these options to change how variant allele calls are displayed in the main table.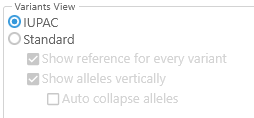
- IUPAC: This is the default option: variants are displayed as IUPAC codes, and indels are displayed as #.
- Standard: Turn on this option to "spell out" full allele calls for each variant, including indels:

- Show reference for every variant: Uncheck this option to show only the alternate allele for each variant (in order to reduce screen clutter):

- Show alleles vertically: This default display mode stacks alleles on top of each other; uncheck the checkbox to show them all on one line, similar to how they would look in the VCF file:

Note that this display mode may make it difficult to see indel sequences at a glance -- but you can always mouse over a variant to display all of its alleles in detail. - Auto collapse alleles: When alleles are shown vertically, hides allele calls that are identical to each other:

This option can be especially useful when displaying tetraploid variants: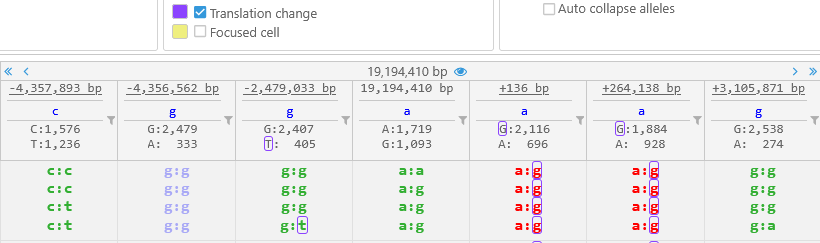
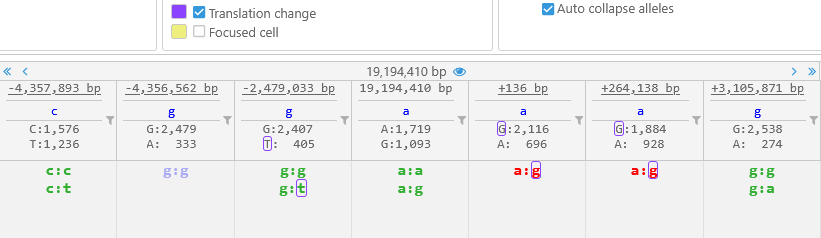
Export
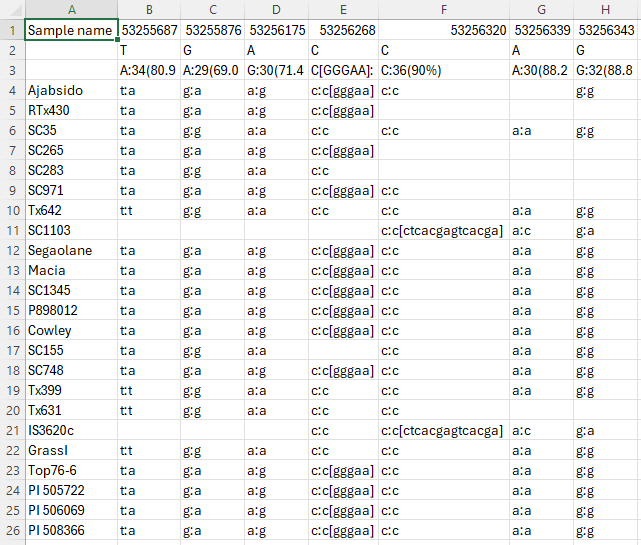
Click the  button in the upper-right corner of the dialog to export the currently visible variants in CSV format.
The exported file can be processed as text, but is also suitable for viewing in Excel:
 Copyright © 2009-2025 by Persephone Software. All Rights Reserved.