Web Persephone: Sequence Alignment
There are two ways in Persephone to compute sequence alignment: large-scale alignment using minimap2, or local alignment using BLASTN.
Large-scale sequence alignment
To perform large-scale alignment, line up two physical maps side-by-side, and click the minimap2 button on the bottom map:
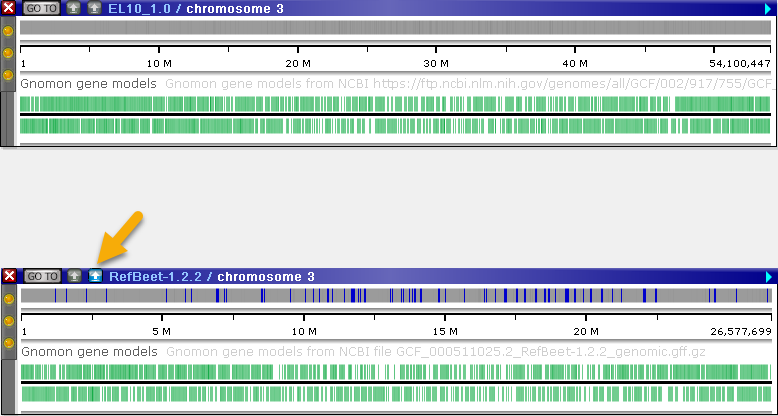
You may see a warning that the map sizes are too large; if so, you can zoom in both maps to select a smaller region. Click the minimap2 button to compute the alignment between the currently visible portions of both maps. This analysis may take anywhere from a few seconds up to about two minutes to compute. You will see a spinner while the analysis is running:
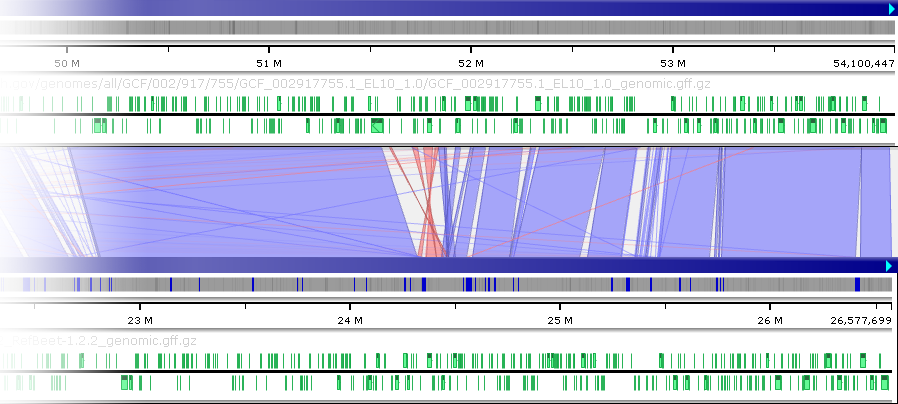
Upon completion, matching sequence blocks will be visualized as ribbons connecting the two maps. While the default settings may not always lead to clean output, you can adjust minimap2 parameters or filter the ribbons in real time to improve the results (as described below). For example:
|
|
|
|
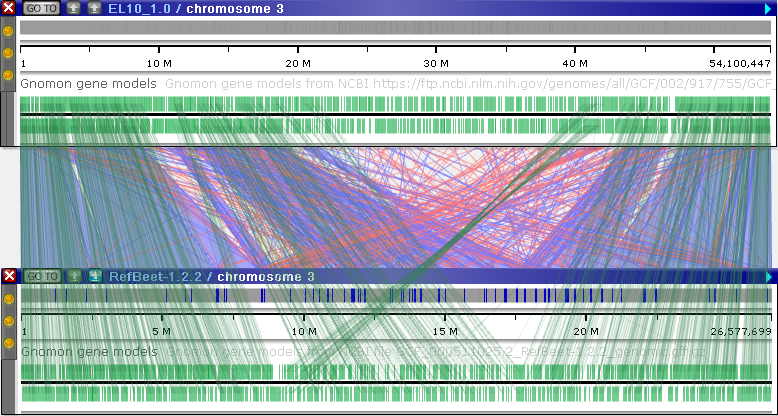
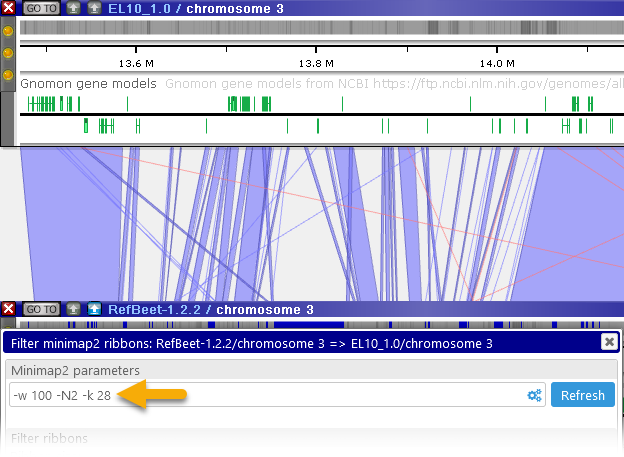
Default parameters: -w 100 -N2 -k 28, line connectors visible |
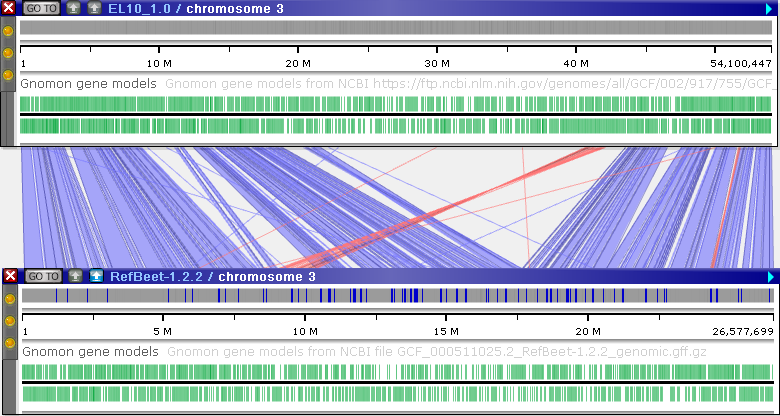
Custom parameters: -w 255 -k 28 --secondary "no" -n 27, line connectors hidden |
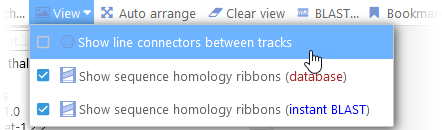
Sometimes the line connectors (between marker tracks or annotation tracks) can obscure the ribbons; if so, you can turn them off from the View menu in the main toolbar:
Light blue ribbons indicate direct matches, whereas red ribbons indicate inversions. You can pan and zoom the maps to view these ribbons in more detail:
You can filter the generated ribbons (as described below), or adjust the minimap2 alignment parameters to produce a cleaner output. To do so, right-click the minimap2 button, and select Filter results to open the minimap2 configuration dialog: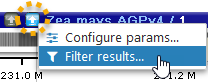
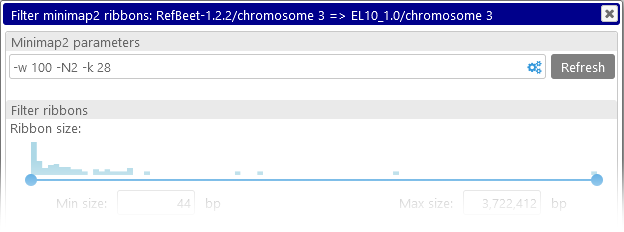
The command-line parameters for the minimap2 tool are displayed at the top. You can edit these parameters directly in the textbox, or click the  button to open the configuration popup window containing some of the most common options:
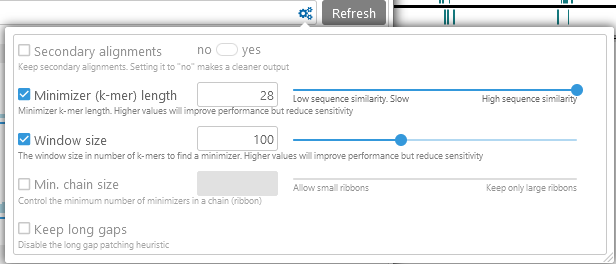
After adjusting the parameters, click the Refresh button to apply them and re-run the analysis.
- Secondary alignments: toggles secondary alignments on or off; uncheck the checkbox to leave this setting as default. Enabling secondary alignments can reveal duplications and repeat regions; disabling them will make the analysis run faster and produce a cleaner output.
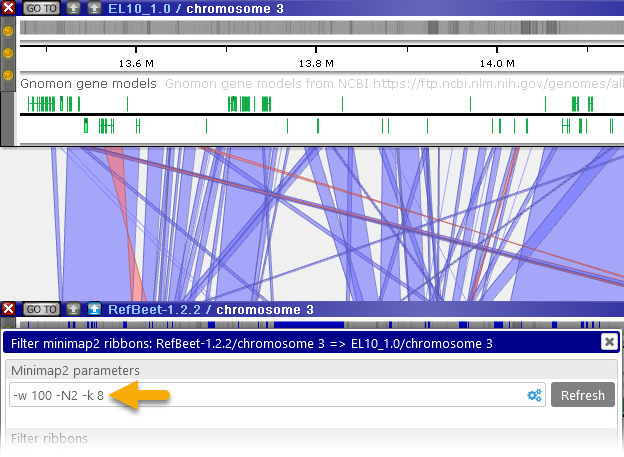
- Minimizer (k-mer) length: controls the sensitivity of the analysis, by changing the required search seed size. Lower values will produce more detailed output (at the expense of making the analysis run slower), potentially revealing additional ribbons inside of large gaps. For example:
Note that you can also use the Local alignment tool (as described below) to perform detailed nucleotide-level alignment on small sequence ranges (up to 1Mbp in length). - Window size: larger window sizes lead to longer distances between minimizers, improving performance at the expense of sensitivity. Use larger values here if you expect the two sequences to have high similarity.
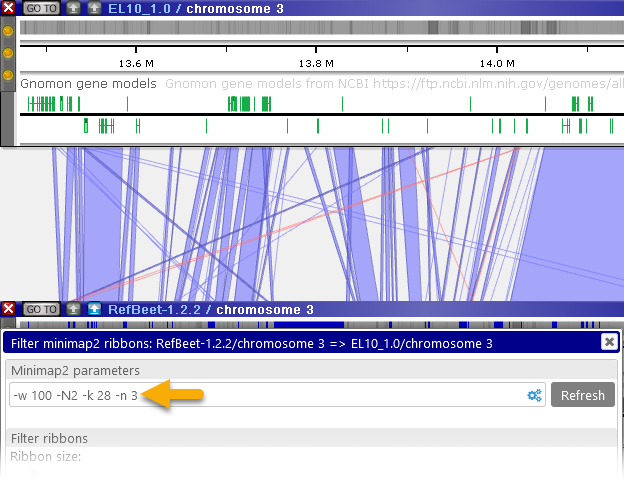
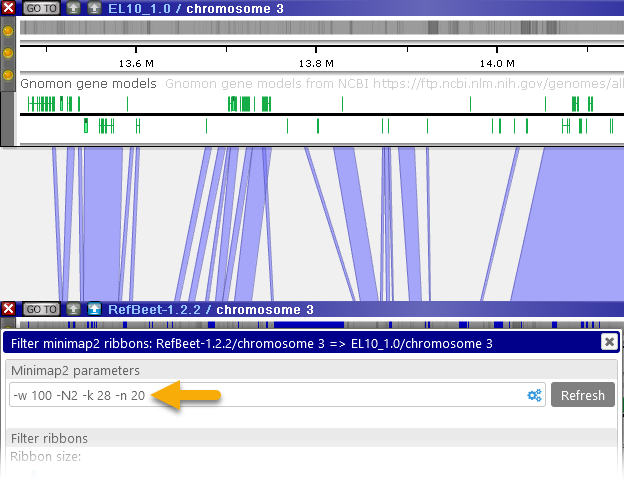
- Min. chain size: the smallest number of hits that are allowed to form a ribbon. Higher values will cause small ribbons to be skipped from the output (which may be useful to reduce clutter):
- Ignore gaps / Max gap allowed: if this option is turned on, long gaps in the alignment will cause ribbons to break up into pieces; by default, minimap2 will attempt to join such ribbons together.
You can also access these parameters from the main Settings dialog.
In addition, you can zoom in both of the maps and click the Instant BLASTN button to align the two sequences using BLASTN. This produces a much more detailed alignment, but can only be used to align relatively short sequence fragments.
Local alignment (Instant BLASTN)
To perform instant local BLASTN alignment, move two physical maps next to each other, then zoom in until both maps display at most 1 Mbp of sequence. The Instant BLASTN button will turn green: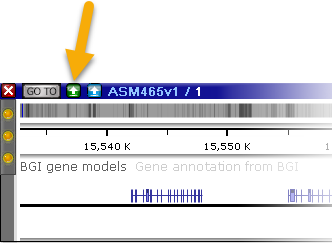
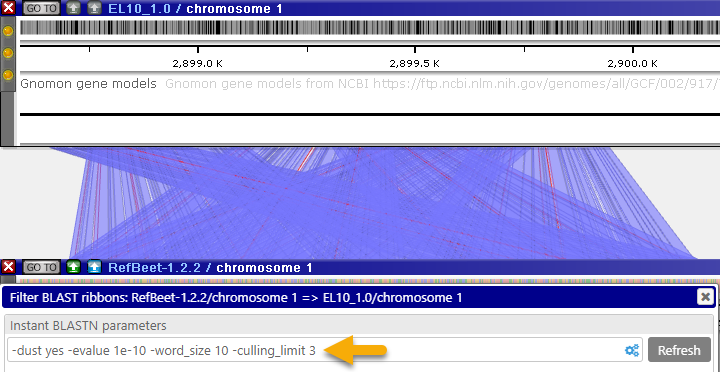
Click the button to run BLASTN between the two maps, and instantly visualize the results as ribbons:
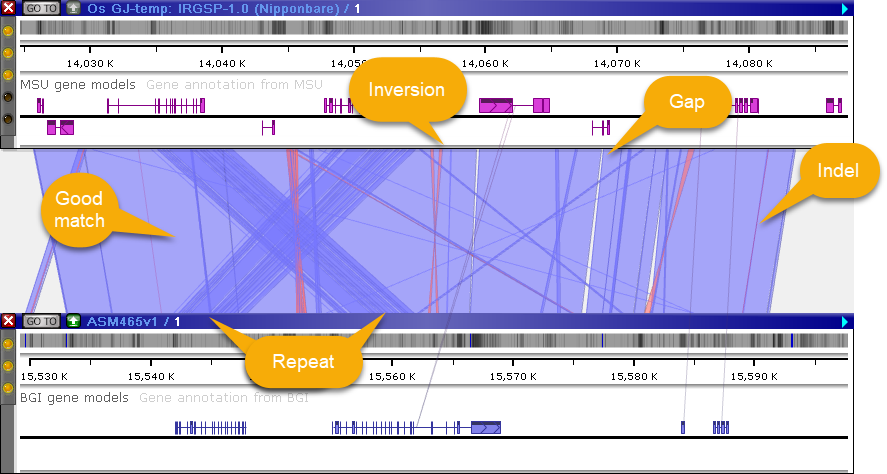
The bottom map is used as the query to BLASTN, and the top map is used as the subject. Solid-colored ribbons (light blue for direct ribbons, light red for inversions) indicate a good match (with 100% identity); empty spaces between ribbons indicate gaps; and red edges indicate insertions/deletions. Overlapping ribbons indicate multiple overlapping HSPs (e.g. due to gene duplication).
As usual, you can zoom in to view individual nucleotides:
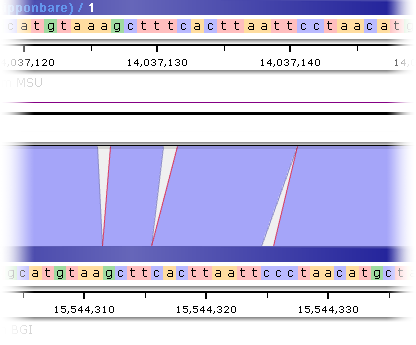
Note that if the number of ribbons is too high, the level of details will be reduced so that one ribbon will represent a single BLAST HSP (a High Scoring Pair). Zoom in to see the details of the HSPs.
You can change these colors in the Settings dialog: select Tools | Settings from the main toolbar, navigate to the Display tab, then click one of the color swatches to change the color:
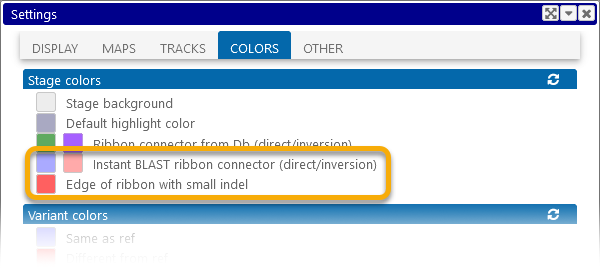
As always, you can click the  button to reset the colors to their defaults.
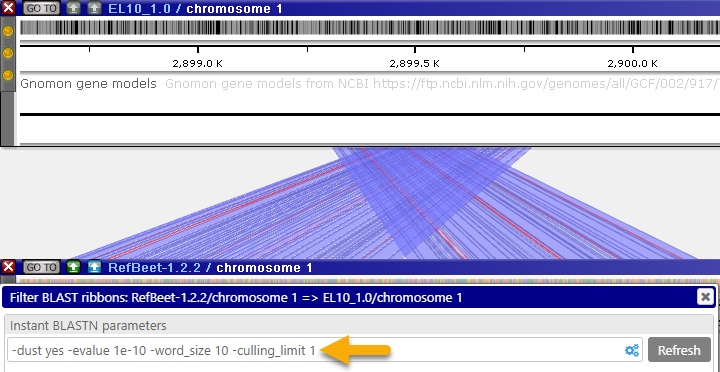
You can also filter the generated ribbons (as described below), or adjust the BLASTN alignment parameters. To do so, right-click the Instant BLASTN button, and select Filter results to open the Instant BLASTN configuration dialog: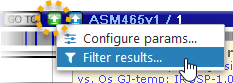
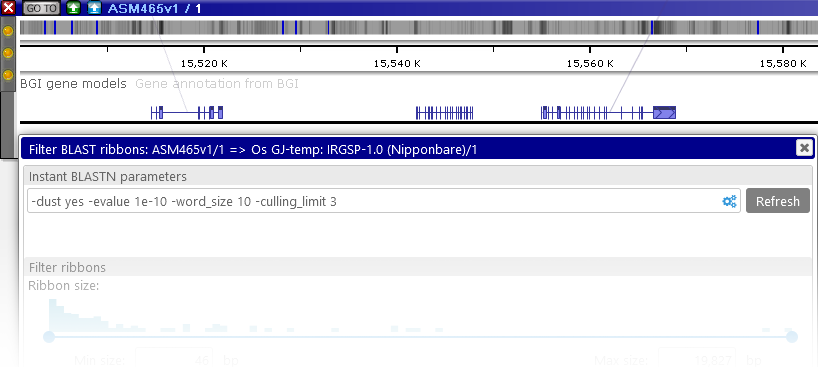
The command-line parameters for the BLASTN tool are displayed at the top. You can edit these parameters directly in the textbox, or click the button to open the configuration popup window containing some of the most common options:
After adjusting the parameters, click the Refresh button to apply them and re-run the analysis.
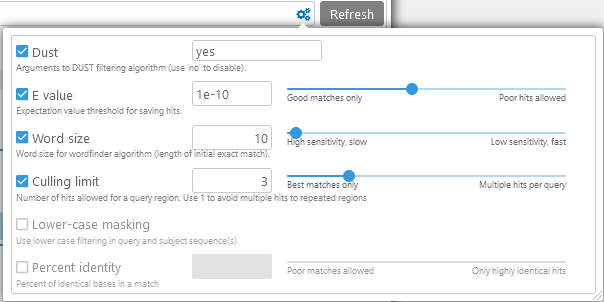
- Dust: Filters out low-complexity regions from the query (i.e. the bottom map). You enter "yes" to use the default settings, "no" to disable DUST filtering, or a set of specific parameters to the DUST algorithm such as "20 64 1".
- E-value: Expectation value threshold for hits. Increase this to allow more poor-quality hits to be displayed.
- Word size: Initial seed size for detecting alignments. Smaller values produce better matches, but make the analysis run slower.
- Culling limit: The total number of matches that are displayed for a given query segment. For example, you can set this value to "1" to hide secondary matches typical for repeat sequences:
- Lower-case masking: Prevents matches in lower-case sequence fragments from showing up in the results.
- Percent identity: Hides hits that have a low ratio of identical bases over the length of the match. Decrease this to allow more poor-quality hits to be displayed.
You can also access these parameters from the main Settings dialog.
Note
To quickly find places where Instant BLASTN is likely to yield informative results, you could open two maps with annotation tracks connected by ortholog links, then use the Align connected features tool to bring connected features against each other, linked by a vertical line.
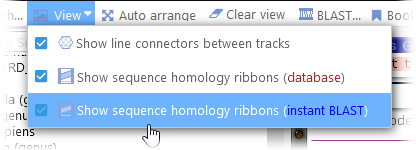
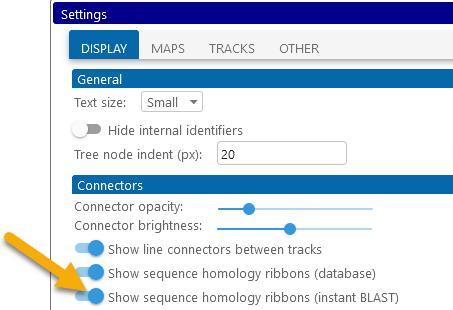
You can also temporarily hide the Instant BLASTN ribbons, either in the View menu of the main toolbar, or on the Display tab of the Settings dialog:
Ribbon filtering
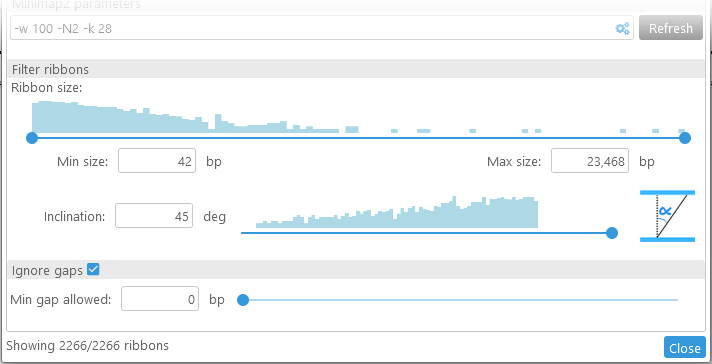
To post-process the ribbons produced by either minimap2 or instant BLASTN, right-click the relevant button on the map , and select Filter results to open the configuration dialog; for example:
Adjustments to any filtering parameters in this dialog have immediate effect on the displayed ribbons (there's no need to click the Refresh button).
- Ribbon size: This slider displays a histogram of ribbon sizes, from shortest to longest (in bp). You can move the slider to decide which ribbons should be visible on screen; for example, you could choose to keep only the shortest ribbons, and hide the rest:
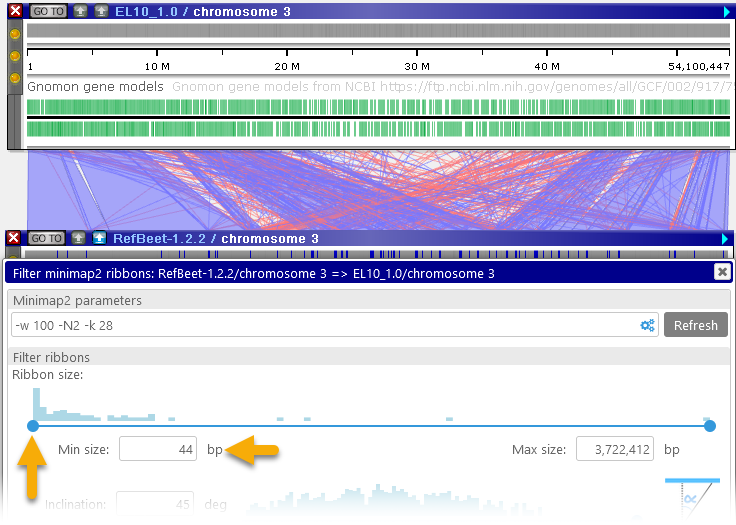
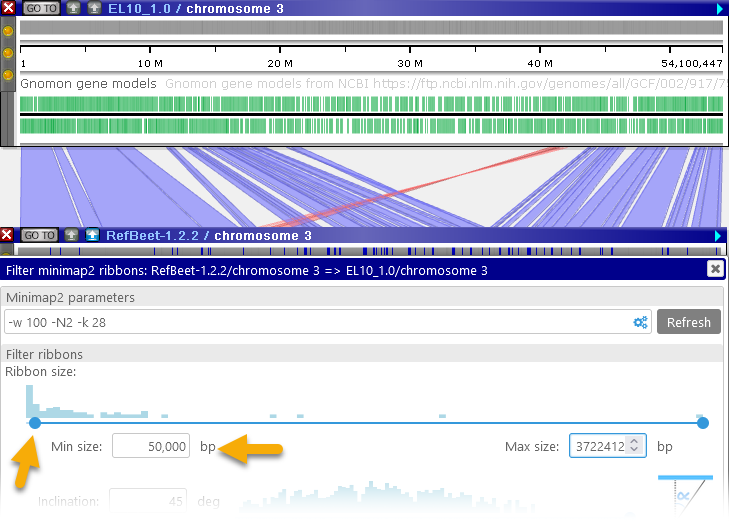
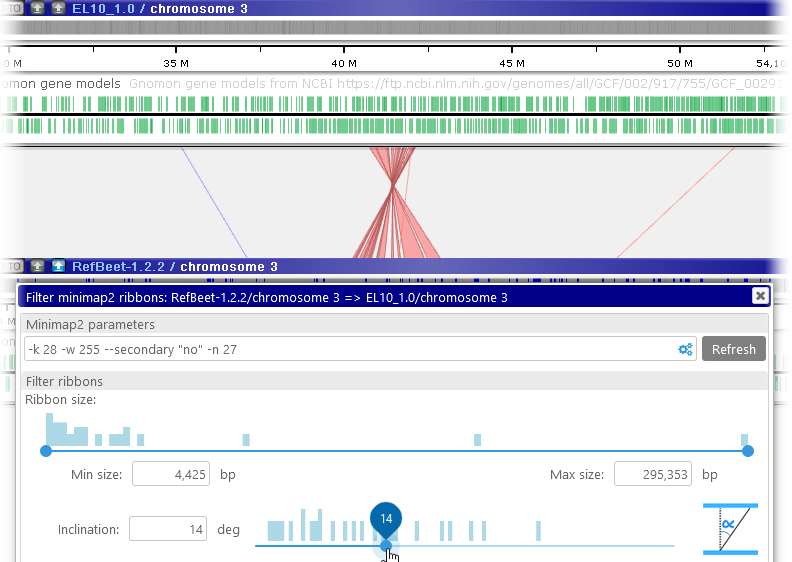
You can make these adjustments by dragging the buttons on the slider, or by manually typing in the desired values. - Inclination: You can use this slider to hide ribbons that start cross over to opposite sides of the two maps:
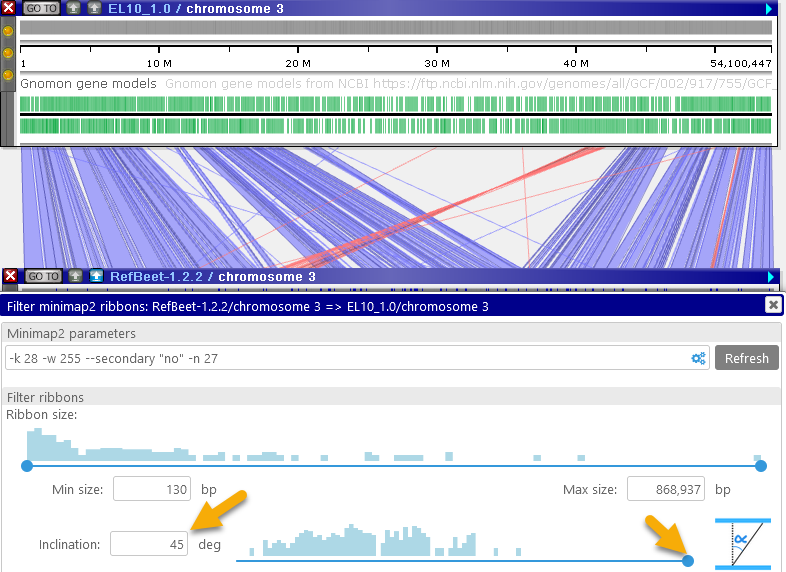
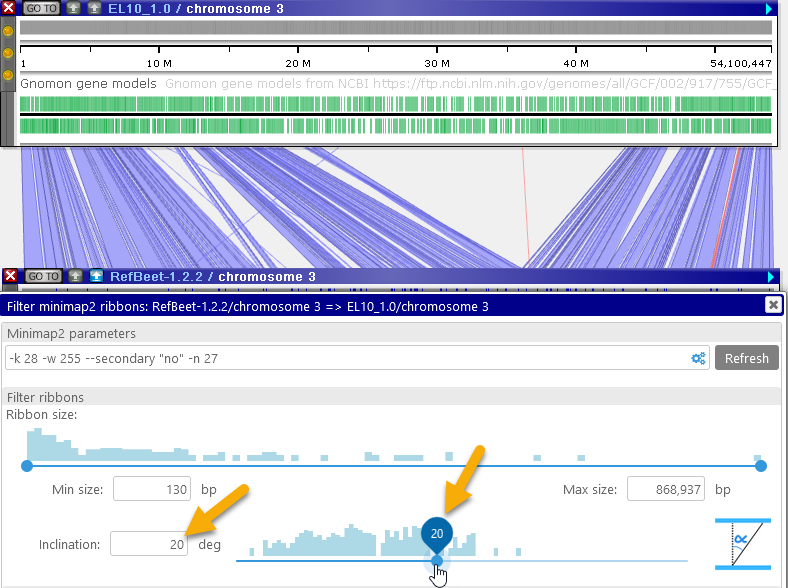
The inclination angle is measured at the time the ribbons are calculated; moving the maps afterwards has no effect on the inclination. However, you can zoom and pan the maps into your preferred position and then re-run the alignment calculation (e.g. by pressing the button); doing so will also re-calculate the ribbon inclination angles. For example, you could do so to focus on the inversion region:
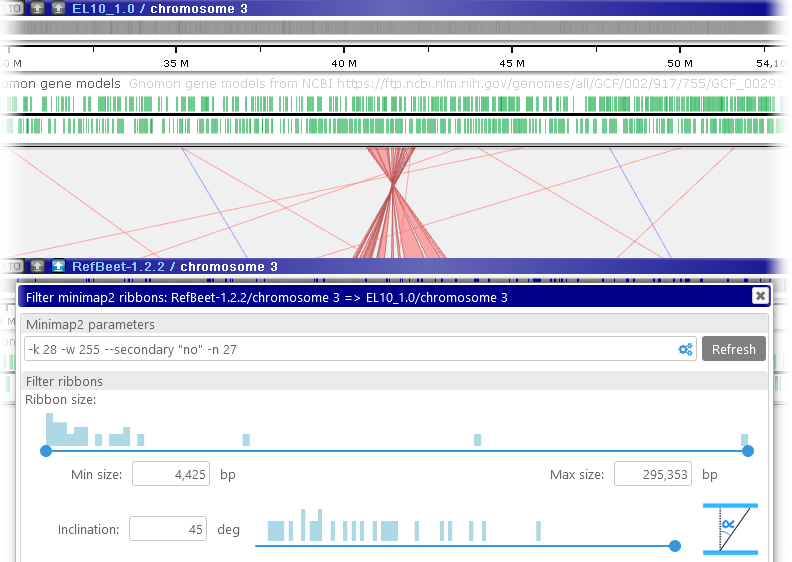
- Fill long gaps: Fills in the gaps between ribbons, potentially combining multiple smaller ribbons into a single large one:
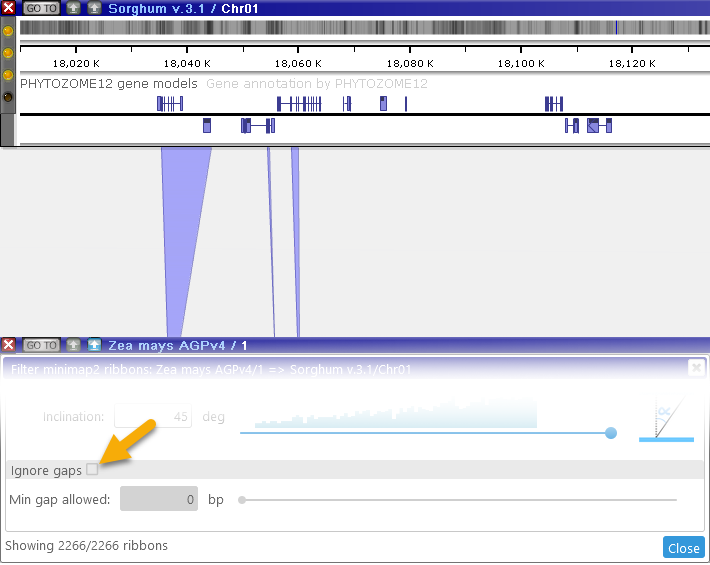
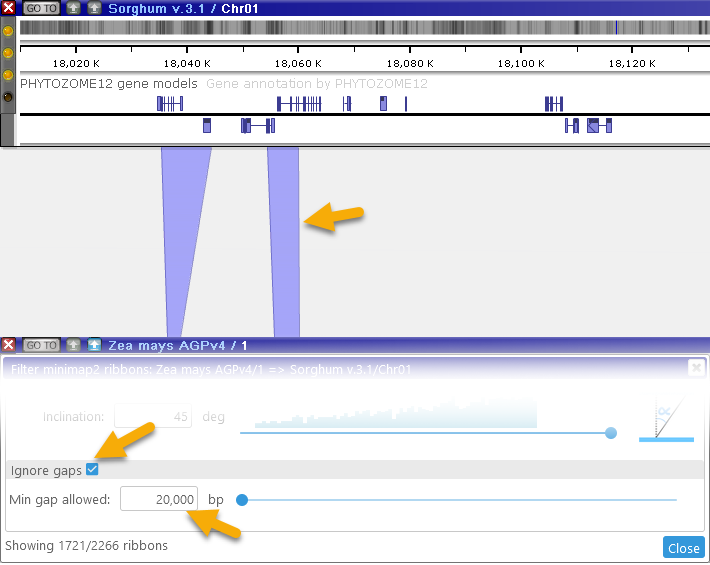
Note that the counter at the bottom always displays the currently visible number of ribbons, as well as the total number of available ribbons.
 Copyright © 2009-2024 by Persephone Software. All Rights Reserved.