Web Persephone: Synteny Matrix
The Synteny Matrix shows a dot plot of all connected features (markers, annotations, or synteny ribbons) between two Map Sets.
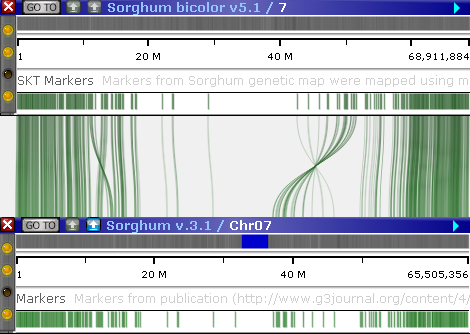
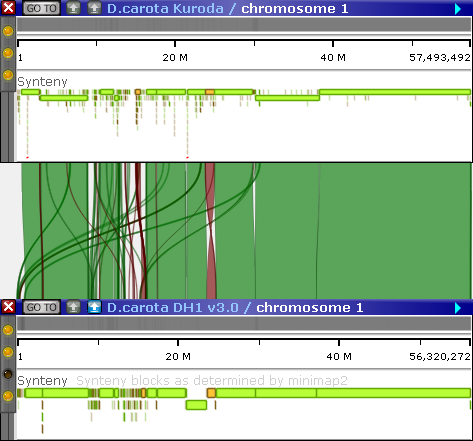
In Persephone, if identical markers are found on two maps displayed on screen, they are automatically linked by a connector line. Orthologous genes are also linked by connector lines, and syntenic blocks are linked by ribbons: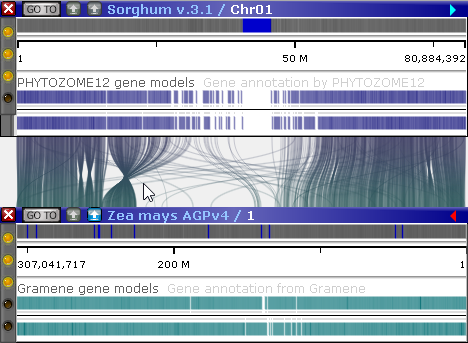
The Synteny Matrix tool visualizes these connections in a more compact way, either as a dot plot or as a parallel plot of all connected maps.
Note that the ortholog gene pairs are currently pre-computed outside of Persephone, usually by PersephoneShell using DIAMOND protein aligner. If you have imported maps from external files and want to link them by connector lines, your options are limited to using marker tracks with common marker names or Persephone's real-time sequence alignment by using minimap2 or BLASTN.
To open Synteny Matrix, select Tools | Synteny Matrix from the main toolbar:
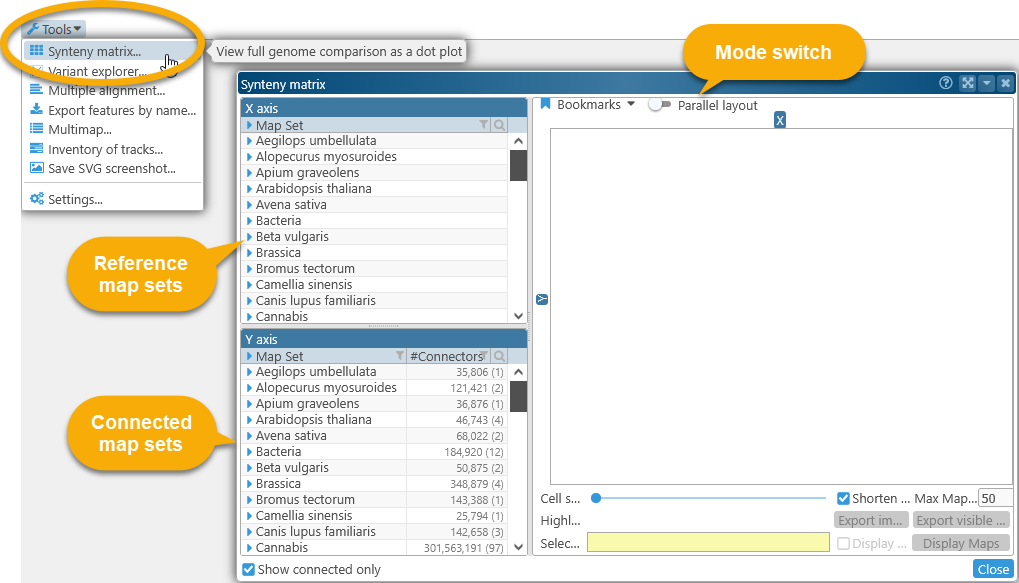
To display the plot, first select a reference Map Set in the X axis tree view in the upper-left (as usual, you can use the standard sorting and filtering controls to quickly find the Map Set of interest). All of the tracks with potential connectors will be listed under the Map Set, each track marked with a glyph indicating its track type. Then, select the track you wish to use as the reference. For example, the Sorghum v.3.1 Map Set can be connected to other Map Sets using either the Markers track, or the PHYTOZOME12 gene models track: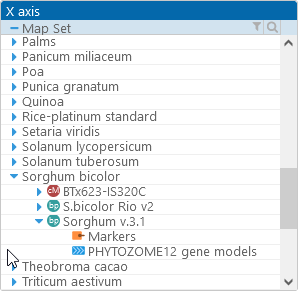
As soon as you select a track, the list of Map Sets on the Y axis (the bottom panel) will update, displaying the count of possible connectors to your chosen track (the number in parentheses displays the count of tracks with available connectors):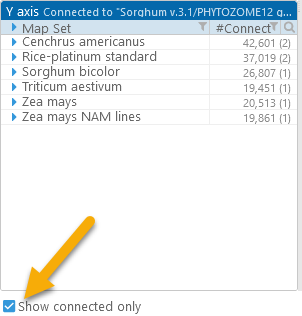
If the Show connected only checkbox is checked, any Map Sets that could not be connected to the chosen track will be hidden from the list.
Select one of the tracks in the Y axis tree to display the plot. By default, the tool opens in Dot plot mode.
Dot Plot
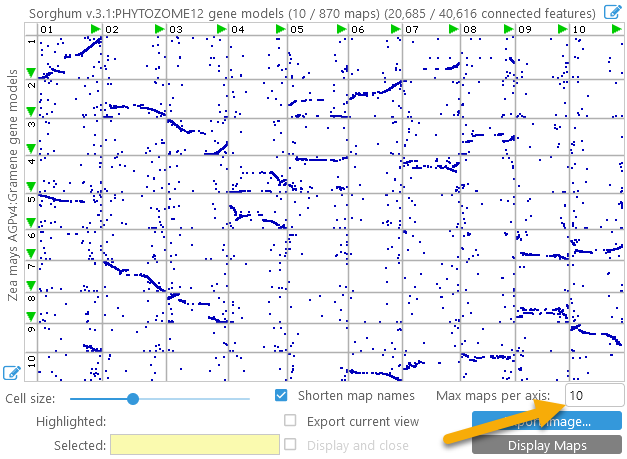
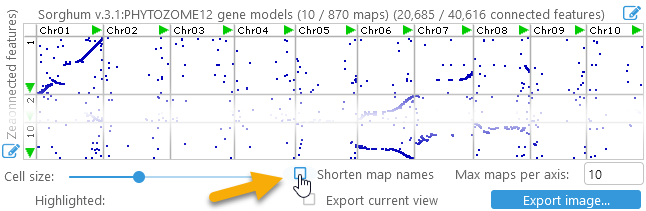
In this mode, connectors between track features (such as orthologous genes or common markers) are shown as dots on the plot. For example, you could display a dot plot of all known orthologs between Sorghum (Sorghum v.3.1) and Corn (Zea mays AGPv4):
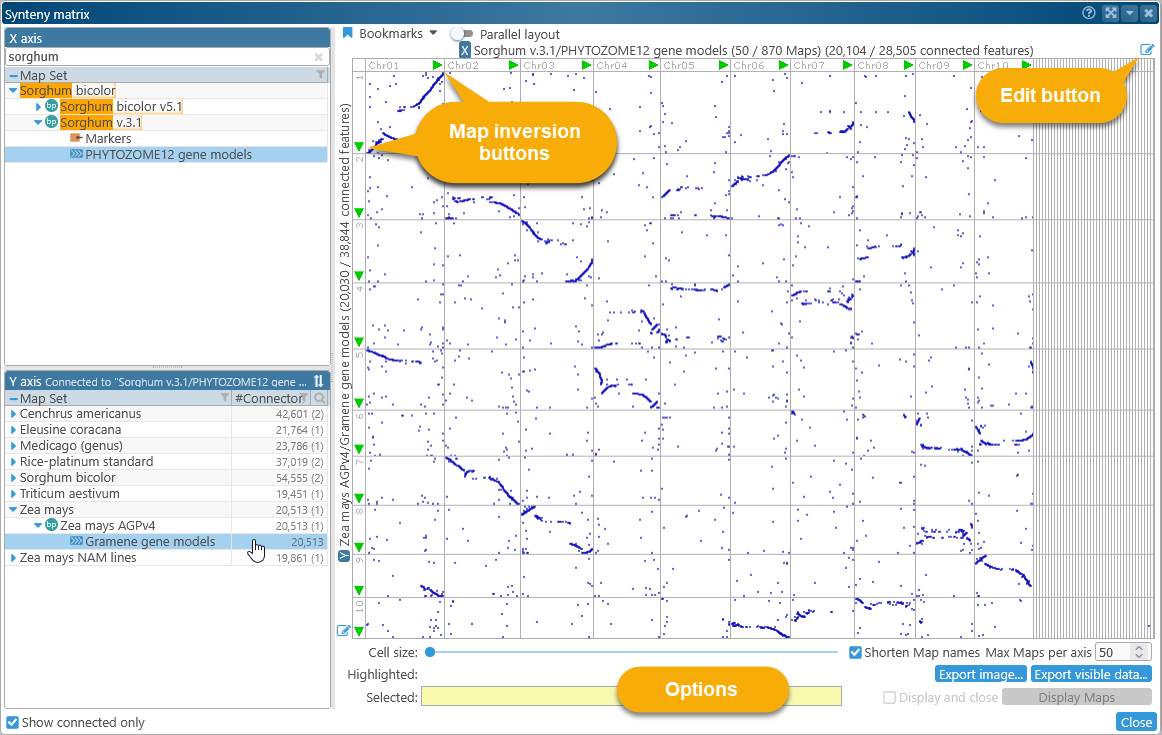
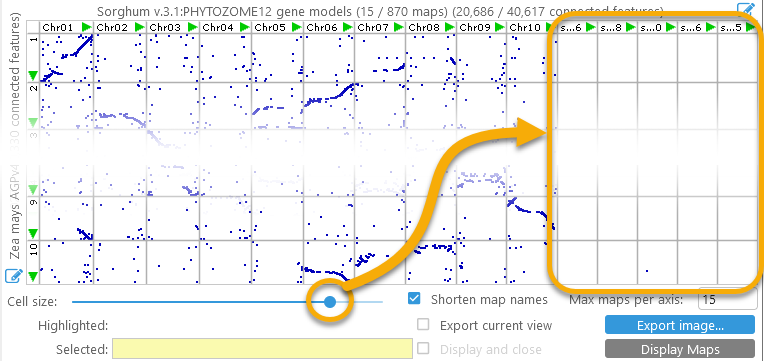
In this plot, every cell represents a pair of tracks, and every dot inside a cell represents an ortholog connector between two gene models: the one in Sorghum (on the X-axis), and the one in Corn (on the Y-axis). The width of each column is proportional to the length of its map in Sorghum; the height of each row is proportional to the length of its map in Corn. This could be inconvenient for Map Sets with a mix of very long and very short maps (e.g. a mix of chromosomes and scaffolds), causing the shorter maps to nearly vanish:
To remedy this, you can use the Cell size slider at the bottom of the dialog to expand the shorter maps:
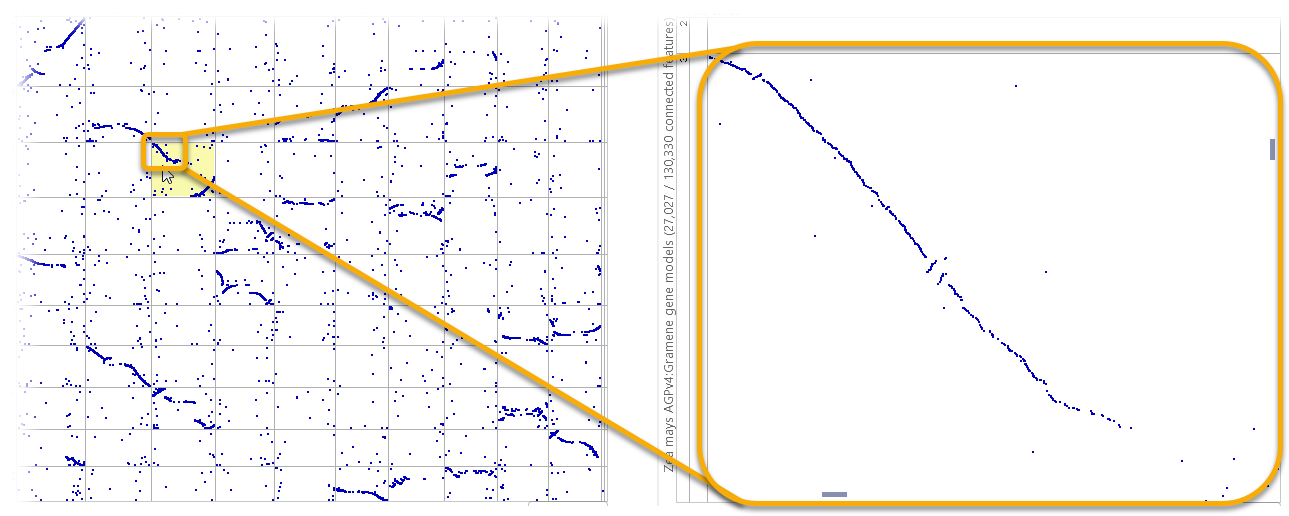
To zoom the dot plot in or out, roll the mouse wheel; to pan the plot, drag it with the left mouse button (or use the scrollbars on the side). For example, you could zoom in on a cell to examine small inversions:
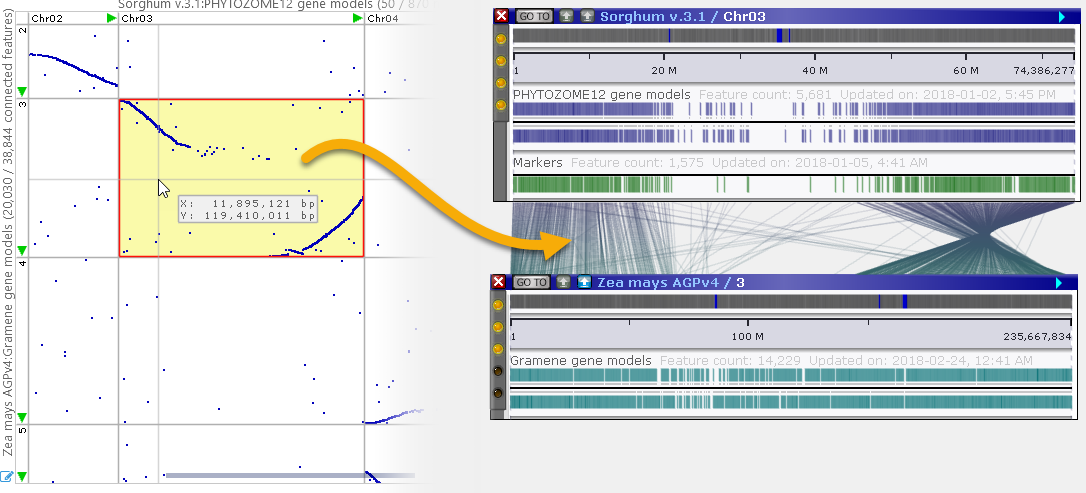
You can double-click a cell to bring its pair of maps into the main view (the Synteny Matrix dialog will briefly fade out to show this happening):
Alternatively, hold down the Ctrl key and drag the mouse over the plot to select a region; then double-click inside the selected region to open the pair of maps. Each map will automatically zoom to the selected region, whose boundaries will be marked with a temporary highlight. For example, you could zoom in on small structural variations: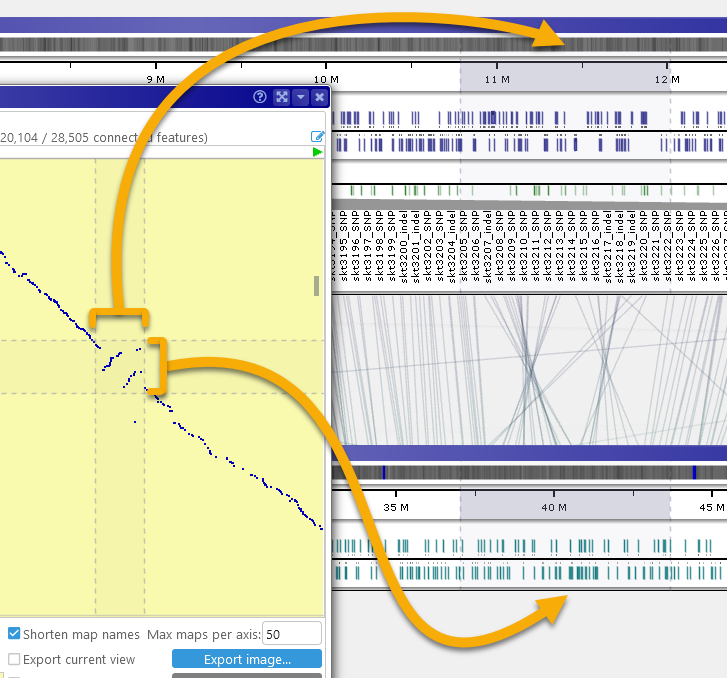
Connector counts
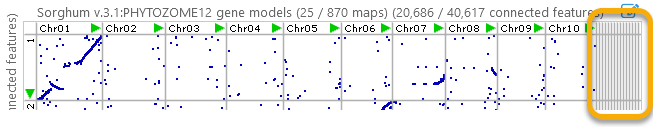
The headers for the X and Y axes display summary information about the plot: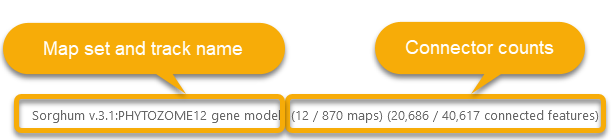
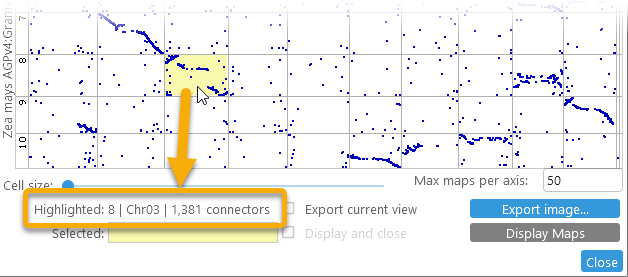
In this example, 12 out of 870 maps in the Map Set Sorghum v.3.1(track PHYTOZOME12 gene models), contained orthologs to the Corn Map Set selected on the Y-axis (in this case, Zea mays AGPv4 (track Gramene gene models). Of the total 40,617 annotations, 20,686 had orthologs in Corn. You can mouse over any cell in the dot plot to see the number of connectors it contains; the cell will be highlighted in yellow, and its name and connector count will be displayed in the Highlighted field at the bottom of the dialog:
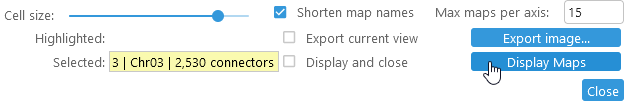
You can also click a cell to select it. The selected cell will be outlined with a red border, and its statistics will be displayed in the Selected field:
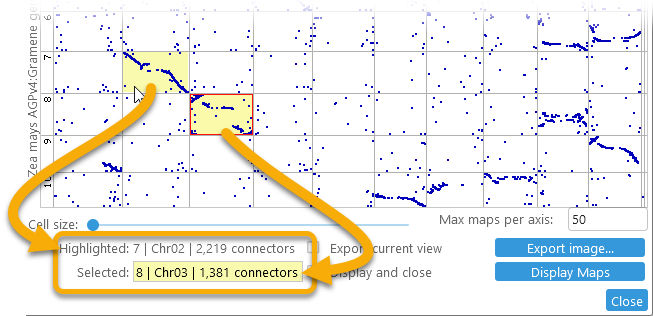
You can use this feature to quickly compare connector counts between two different pairs of maps. Click the selected cell again to deselect it.
Map selection and orientation
You can change the selection of maps on each axis in a variety of ways. Firstly, to change the limit for the number of maps displayed on both of the axes in the Synteny Matrix plot, enter a new value in the Max maps per axis textbox:
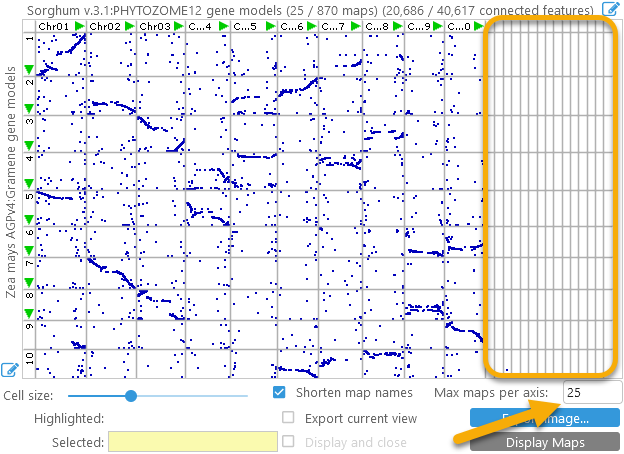
This can be a quick way to remove unnecessary maps such as scaffolds or assembly fragments from the plot, leaving only the chromosomes (by default, chromosomes are always displayed first). You can also click the  button next to the X- or Y-axis to open the Edit Maps dialog, where you can fully customize the list of displayed maps for that axis:
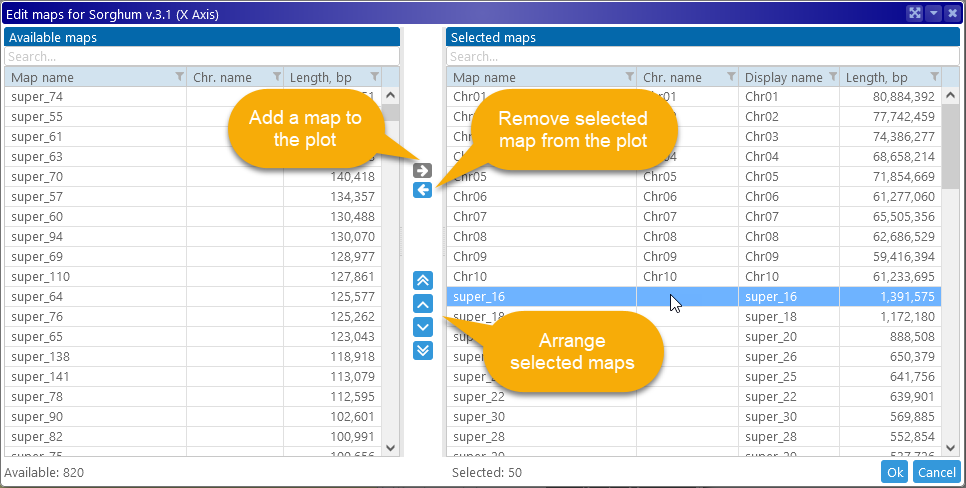
You can also reorder maps directly in the plot. To do so, grab a map header with the left mouse button, then drag it to the desired location. As you are dragging the map, a gray line will appear in the plot, indicating the new location of the map:
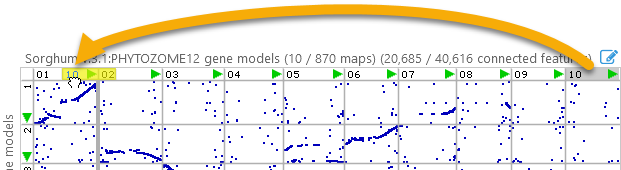
Release the mouse to drop the map at the desired location.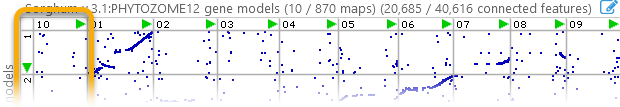
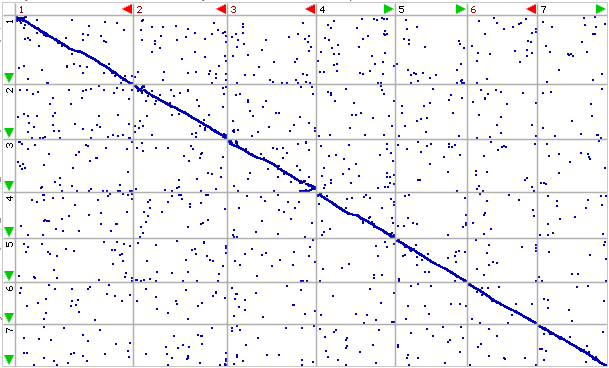
To flip a map, click the green arrow button next to its header in the plot. The arrow will point in the opposite direction and turn red, indicating that the map is inverted. This can be useful if you wish to line up the maps so that their connectors form a central diagonal, regardless of their default orientation in the original assembly: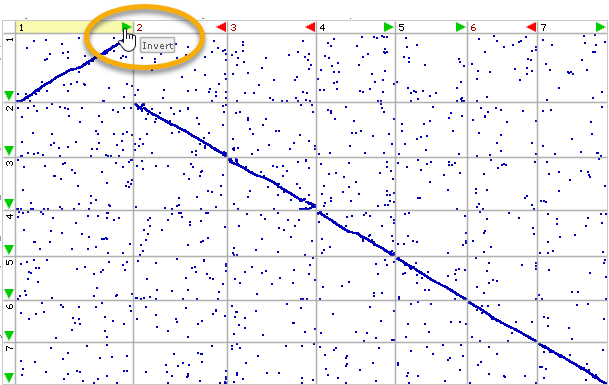
Map names
By default, if all maps on an axis share a common prefix, that prefix is hidden from view (in order to save space and reduce clutter). For example, if all the maps are named "Chr01", "Chr02", and so on, then the "Chr" prefix will be hidden, leaving just "01", "02", and so on. You can uncheck the Shorten map names checkbox to display full map names in the plot: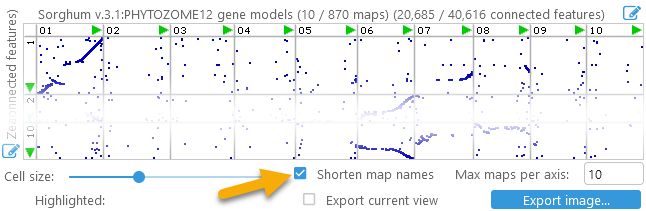
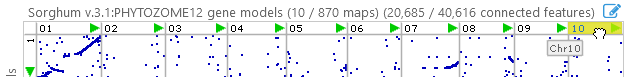
You can always hover the mouse over a map header to display its full name in a tooltip: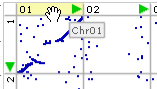
Options
Click the Display Maps button to display the pair of maps for the currently selected cell (alternatively you could double-click the cell, as described above). If the Display and close checkbox is checked, the Synteny Matrix dialog will automatically close when you click the Display Maps button (although it will return to the same view the next time it is opened).
Click the Export Image button to export the entire plot as a high-resolution bitmap, suitable for publication:
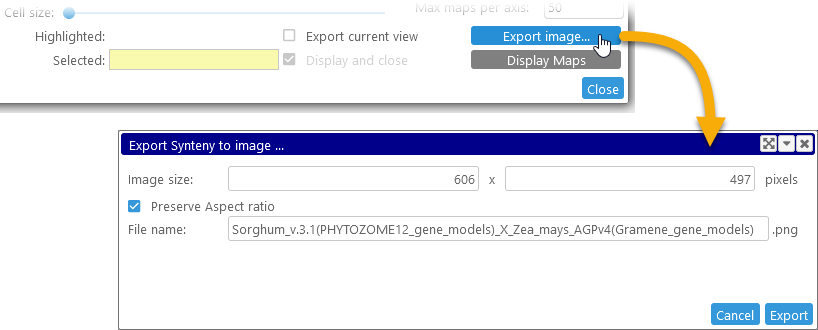
In this dialog, you can change the pixel dimensions of the exported image (if the Preserve Aspect ratio checkbox is checked, the image will maintain the aspect ratio of the Synteny Matrix dialog). Click the Export button to download the image as a PNG file. By default, the entire dot plot is exported, but you can check the Export current view checkbox in the main dialog to export only the current zoomed-in view.
Parallel view
In this mode, connected tracks from the selected X axis Map Set are displayed in-line at the top, and the corresponding Y axis tracks are displayed at the bottom, with connectors between them drawn as curved lines. To switch to the parallel view, use the mode switcher at the top of the dialog: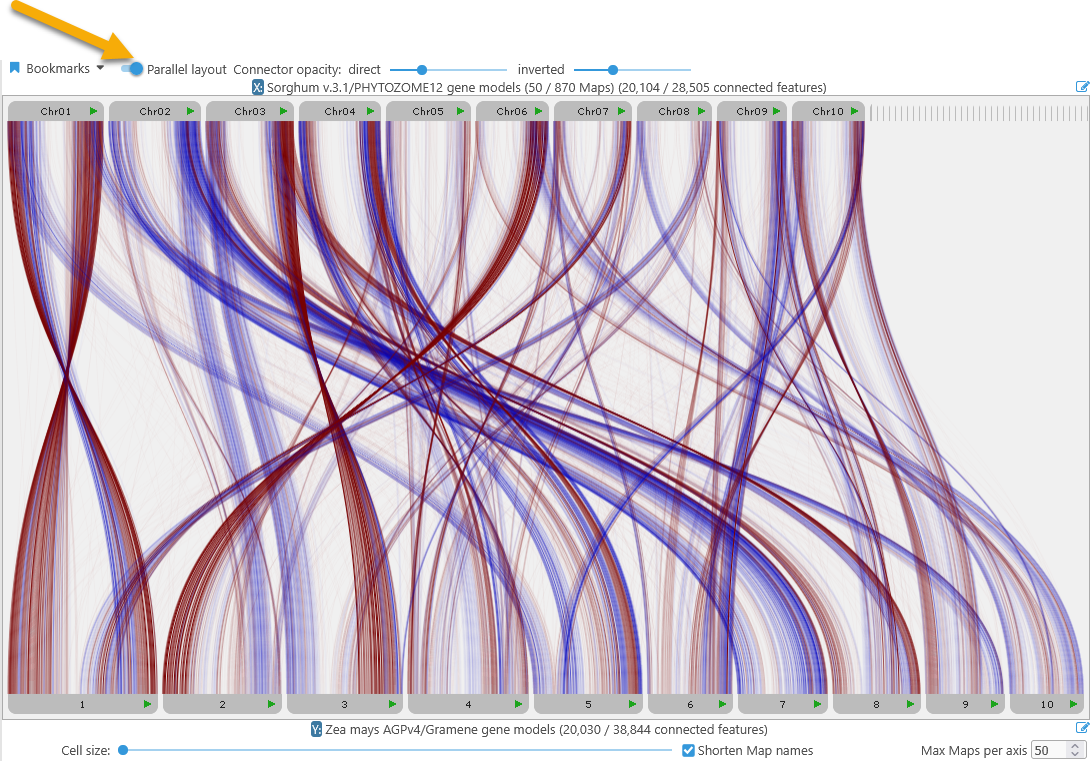
Direct connectors (i.e. those between track features or syntenic blocks on the same strand) are shown in blue; inverted connectors are shown in red. You can use the connector opacity sliders at the top to make either group of connectors more transparent; for example, you could de-emphasize direct connectors and emphasize inverted ones: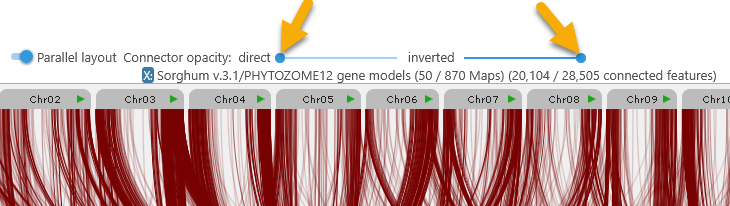
Place your mouse over the plot and roll the mouse wheel to zoom the entire plot in and out; click and drag the mouse on the plot to pan it left or right: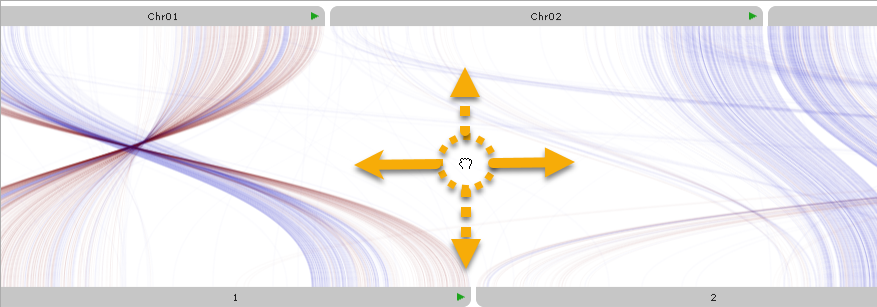
Mouse over a map's label to fade out all other connectors, leaving only those that belong to the map: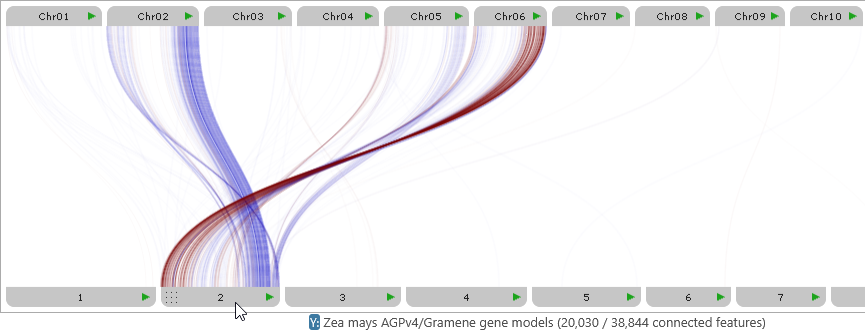
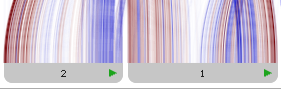
You can also double-click a map's label to quickly expand it to fill the entire plot: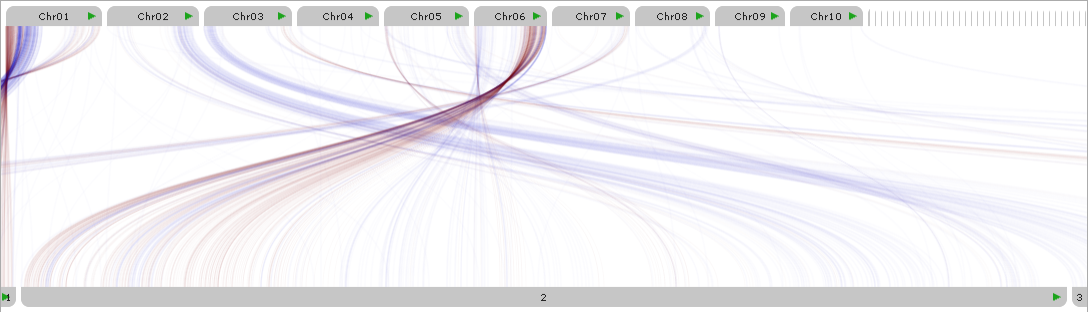
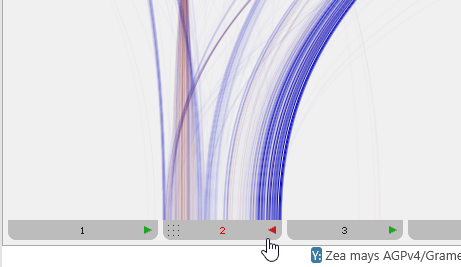
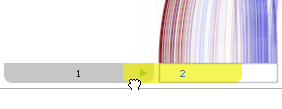
Click the inversion arrow on a map's label to flip the map (just as you would in the Dot plot view):
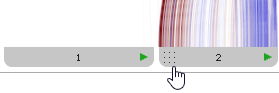
To rearrange maps, mouse over one of the map labels, then drag-and drop its  drag handle:
Click a map to temporarily pin it in the view. Pinned map labels are outlined with an orange border, and their connectors are always visible, while connectors from other maps are hidden. For example, you could pin Chromosomes 1 and 5 of Corn (at the bottom of the plot):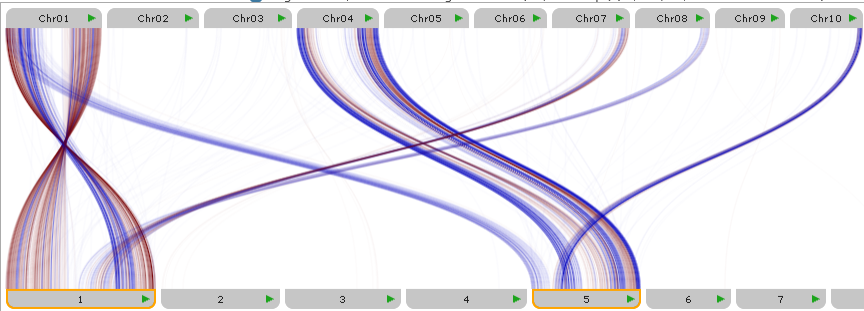
Pin maps on both sides of the plot to further filter down the displayed connectors. For example, you could additionally pin Chr01 of Sorghum (at the top of the plot), to show only the connectors between Sorghum's chromosome 1, and Corn's chromosomes 1 and 5: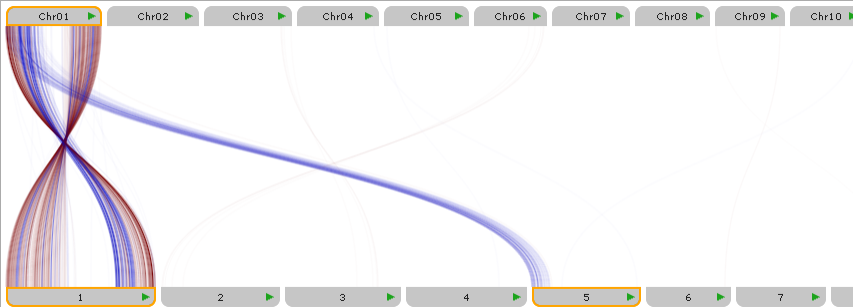
 Copyright © 2009-2025 by Persephone Software. All Rights Reserved.