Web Persephone: Statistics
Map Set statistics
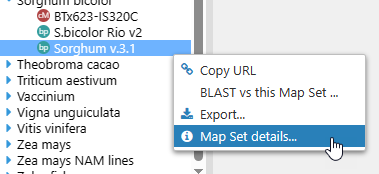
The Statistics tab in the Map Set details dialog describes the distribution of map lengths in the Map set. To view these statistics, open the Map Set details dialog, e.g. by right-clicking the map set and selecting Map set details from the popup menu:
Then, click on the Statistics tab:
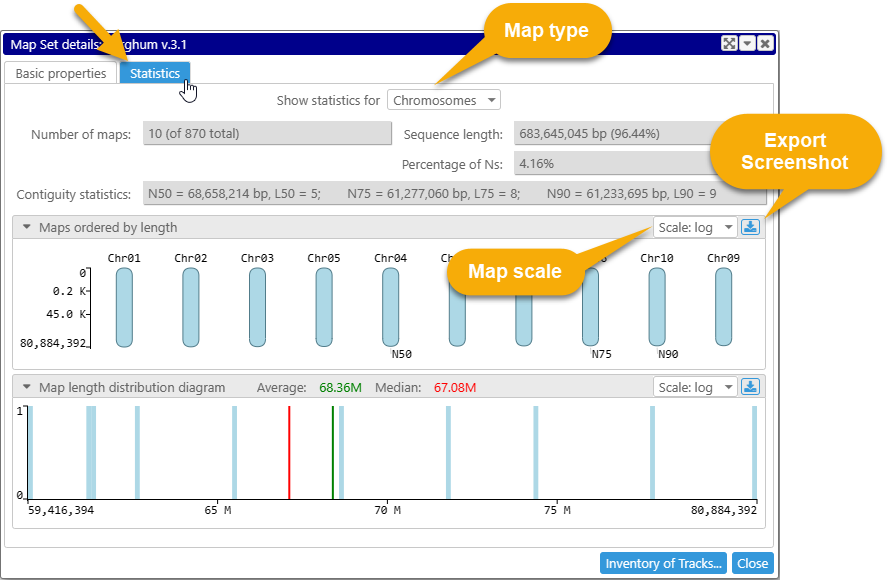
The Map type selector at the top determines whether statistics should be restricted to all maps, only chromosomes (excluding other contigs such as scaffolds), or only non-chromosomes. By default, statistics are shown only for chromosomes, but you can change this by selecting another option:
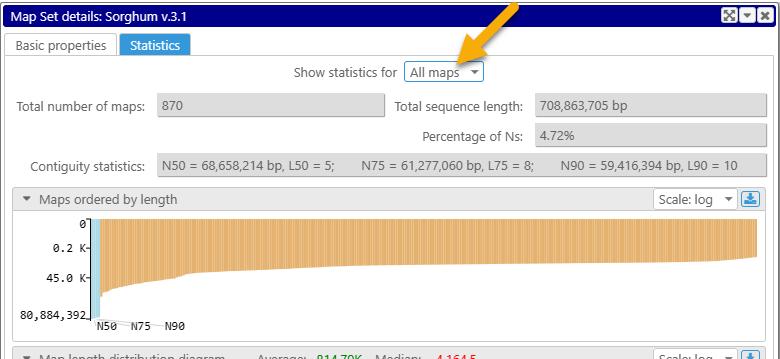
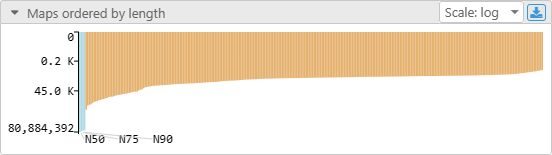
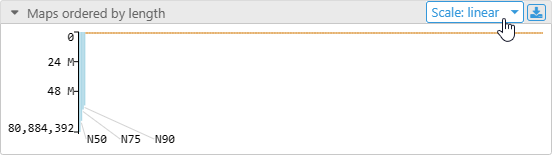
In this view, chromosomes are colored in light blue, and non-chromosomes in orange.
The top portion of the dialog summarizes numeric statistics for the map set. This summary is available for both physical and genetic map sets, although most of the information is only applicable to physical maps:
- Total number of maps: the number of maps included in the current statistics readout, as well as the total number of maps in the map set.
- Total sequence length: the number of nucleotides covered by the currently selected subset of maps, as a percentage of total map length for the entire map set.
- Percentage of Ns: percentage of Ns in the current currently selected subset of maps; high values may indicate poor assembly quality.
- Contiguity statistics: measures of assembly quality in terms of contiguity.
- N50/N75/N90: the length of the shortest map at 50% of assembly length. For example, the total number of bases covered by maps longer than the N50 will be approximately equal to the number of bases covered by maps shorter than the N50.
- L50/L75/L90: the smallest number of contigs whose cumulative length makes up 50%/75%/90% of the total genome size.
Note that these contiguity statistics are relative to the total size of the map set, and thus cannot be meaningfully compared across map sets whose sizes differ significantly from one another.
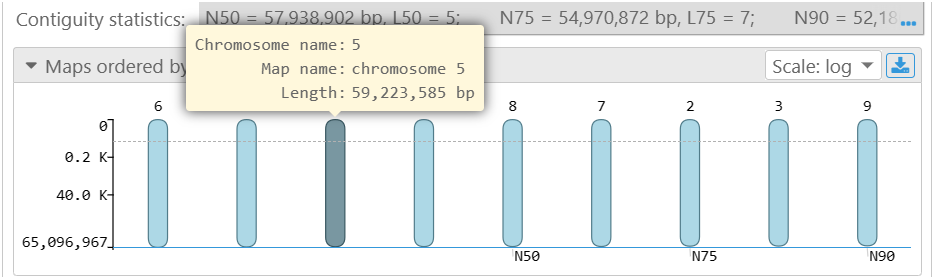
The middle portion of the dialog displays these statistics visually. You can mouse over a map to view information about it in a tooltip:
By default, maps are displayed on a logarithmic scale, but you can change this by selecting a different option from the dropdown menu in the upper-right corner:
Click the  button (next to the scale selector) to save the graph as a screenshot in SVG format (suitable for publication).
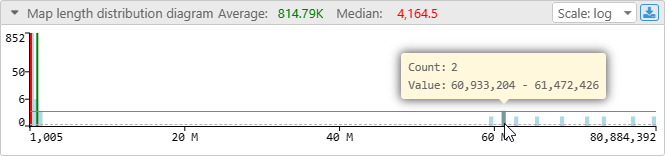
The graph at the bottom of the dialog displays a histogram of map length distributions in the map set. The arithmetic average map length is indicated in green, and the median map length in red. Mouse over a bin on the histogram to see its exact size, as well as the number of maps that fall within the bin:
Annotation track statistics
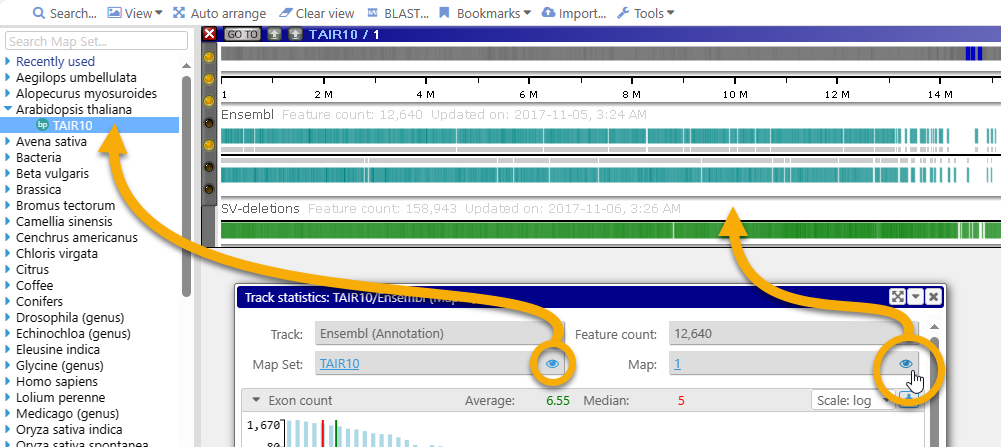
The Annotation track statistics dialog functions similarly to the Map set statistics dialog, but displays statistics about a single Annotation track on a single map. To access these statistics, open Map/Track details, then click the  icon next to the desired track:
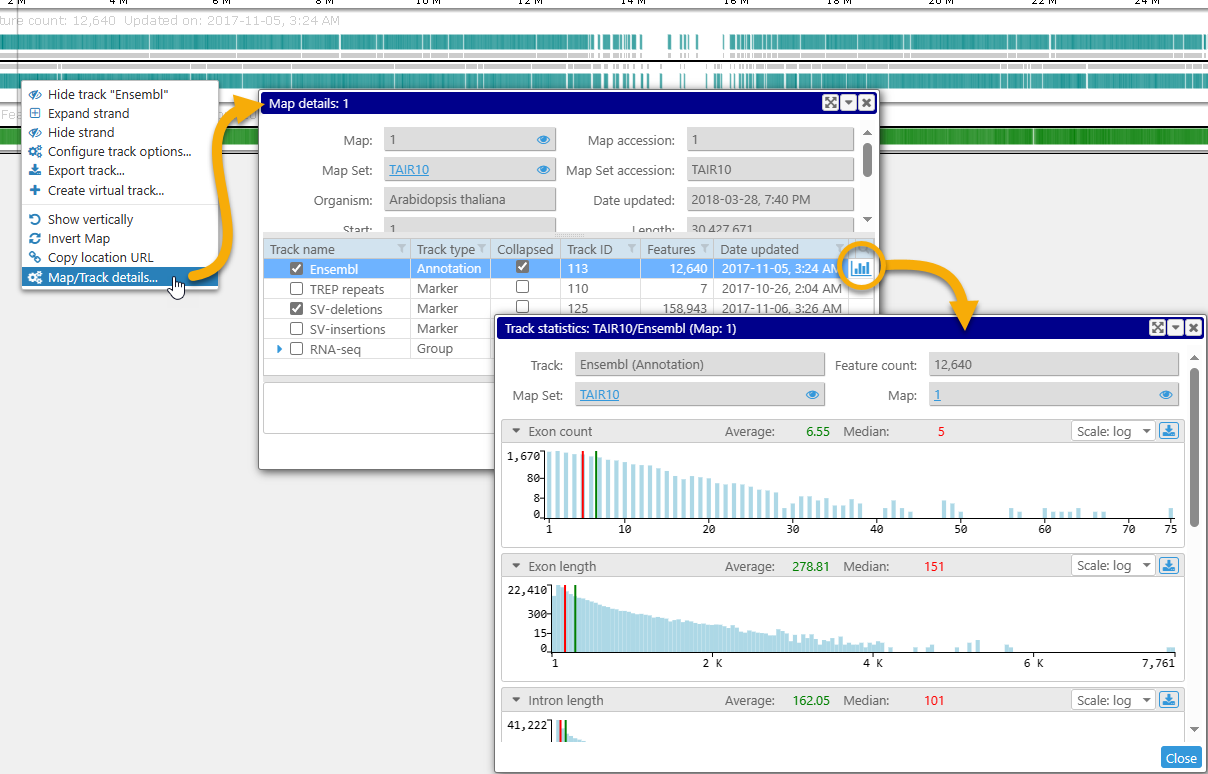
The top portion of the dialog contains the name of the track, Map set, and map on which these statistics were calculated, as well as the number of annotation features (i.e. transcripts) on the track. You can click the name of the Map set and the map to view more information about them; click the  icon next to the Map set to reveal it in the main Map set tree; or click the icon next to the map to bring it into the main Persephone view (assuming it was not already visible):
The rest of the dialog is occupied by histograms of individual statistic measures (you may need to scroll down to see all of them). You can mouse over a histogram bin to view its contents in more detail:
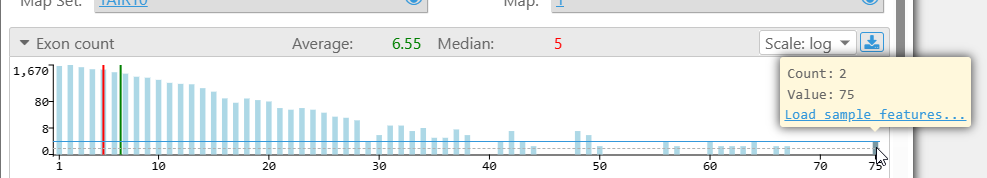
The solid blue hairline on the chart indicates the height of the bin, and the dotted gray line indicates the current position of the mouse cursor. Click the Load sample features link in the popup tooltip to load first 20 features that fit into this histogram bin (in this example, there are only 2 transcripts composed of 75 exons, so both of them will be loaded). The list will appear underneath the chart:
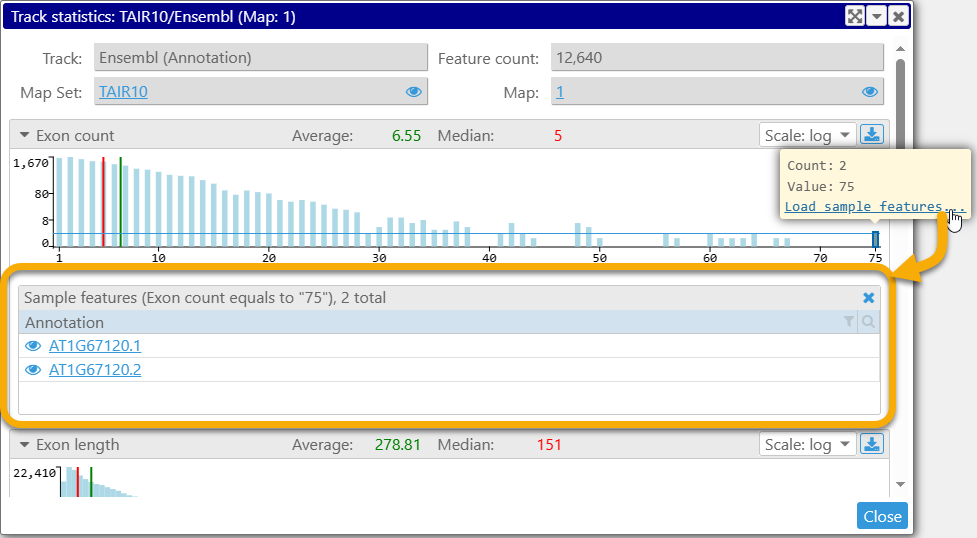
You can search and filter this list using Persephone's common search and filtering controls; click the name of each transcript to open its Annotation details, or click the icon to reveal it on the map. You can also click the  button in the upper-right corner to close the list of sample features.
 Copyright © 2009-2024 by Persephone Software. All Rights Reserved.